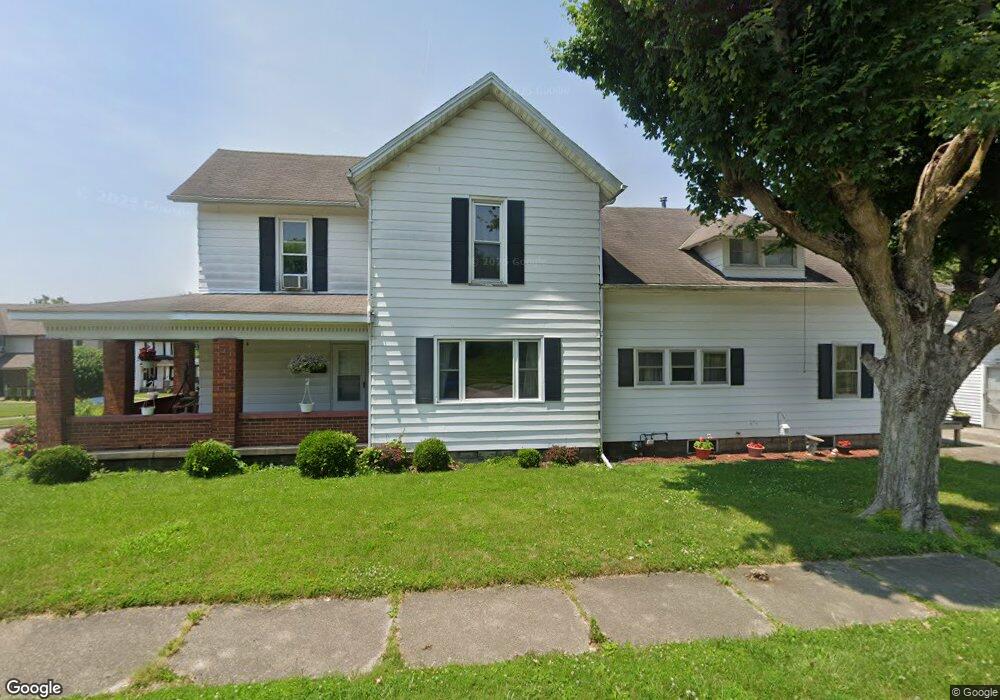
818 Broad St New Castle, IN 47362
Estimated Value: $143,000 - $178,400
4
Beds
2
Baths
2,216
Sq Ft
$70/Sq Ft
Est. Value
About This Home
This home is located at 818 Broad St, New Castle, IN 47362 and is currently estimated at $155,850, approximately $70 per square foot. 818 Broad St is a home located in Henry County with nearby schools including Agape Learning Center and Heartland Christian School.
Ownership History
Date
Name
Owned For
Owner Type
Purchase Details
Closed on
Apr 28, 2011
Sold by
Stegner Chad J
Bought by
Dishman Tonya
Current Estimated Value
Home Financials for this Owner
Home Financials are based on the most recent Mortgage that was taken out on this home.
Original Mortgage
$72,538
Outstanding Balance
$50,596
Interest Rate
4.96%
Mortgage Type
New Conventional
Estimated Equity
$105,254
Purchase Details
Closed on
Feb 24, 2010
Sold by
Secretary Of Hud
Bought by
Stegner Chad J
Purchase Details
Closed on
Jun 19, 2009
Sold by
Colonial Savings Fa
Bought by
Secretary Of Hud
Purchase Details
Closed on
Jun 2, 2009
Sold by
Moore Brian E
Bought by
Colonial Savings Fa
Create a Home Valuation Report for This Property
The Home Valuation Report is an in-depth analysis detailing your home's value as well as a comparison with similar homes in the area
Home Values in the Area
Average Home Value in this Area
Purchase History
| Date | Buyer | Sale Price | Title Company |
|---|---|---|---|
| Dishman Tonya | -- | None Available | |
| Stegner Chad J | -- | None Available | |
| Secretary Of Hud | -- | None Available | |
| Colonial Savings Fa | $83,214 | None Available |
Source: Public Records
Mortgage History
| Date | Status | Borrower | Loan Amount |
|---|---|---|---|
| Open | Dishman Tonya | $72,538 |
Source: Public Records
Tax History Compared to Growth
Tax History
| Year | Tax Paid | Tax Assessment Tax Assessment Total Assessment is a certain percentage of the fair market value that is determined by local assessors to be the total taxable value of land and additions on the property. | Land | Improvement |
|---|---|---|---|---|
| 2024 | $1,278 | $127,800 | $16,800 | $111,000 |
| 2023 | $1,222 | $122,200 | $16,800 | $105,400 |
| 2022 | $1,040 | $104,000 | $8,400 | $95,600 |
| 2021 | $861 | $86,100 | $7,300 | $78,800 |
| 2020 | $915 | $86,600 | $7,300 | $79,300 |
| 2019 | $1,091 | $84,800 | $7,300 | $77,500 |
| 2018 | $935 | $82,400 | $6,700 | $75,700 |
| 2017 | $900 | $82,600 | $6,700 | $75,900 |
| 2016 | $878 | $80,800 | $6,500 | $74,300 |
| 2014 | $720 | $76,300 | $7,600 | $68,700 |
| 2013 | $720 | $71,600 | $7,500 | $64,100 |
Source: Public Records
Map
Nearby Homes