Estimated Value: $169,000 - $183,000
4
Beds
2
Baths
1,661
Sq Ft
$108/Sq Ft
Est. Value
About This Home
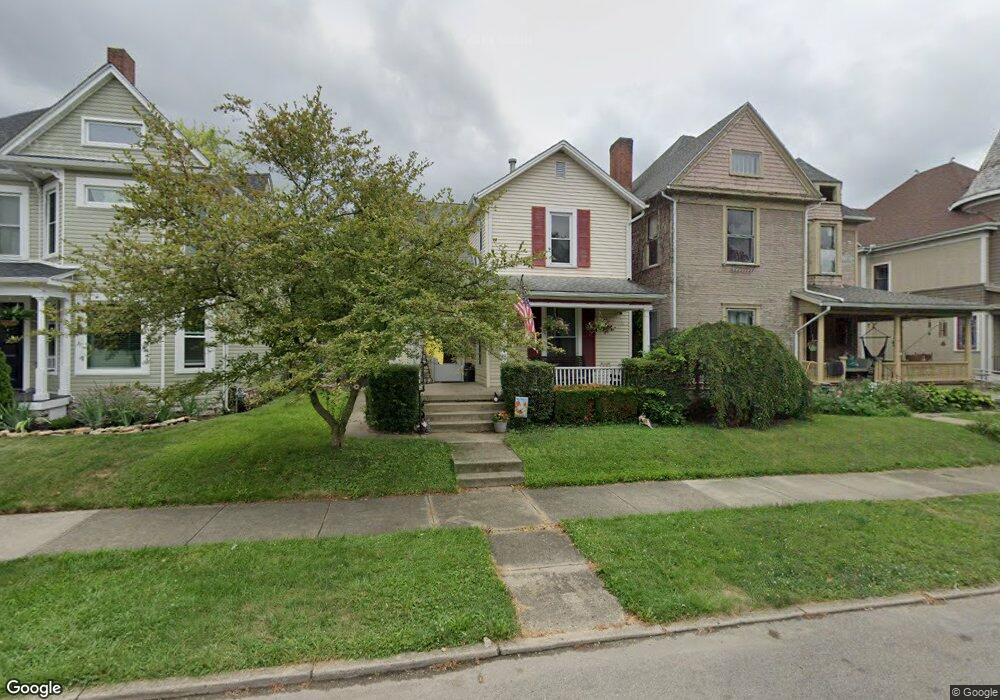
This home is located at 818 Caldwell St, Piqua, OH 45356 and is currently estimated at $178,605, approximately $107 per square foot. 818 Caldwell St is a home located in Miami County with nearby schools including Piqua Central Intermediate School, Springcreek Primary School, and Piqua Junior High School.
Ownership History
Date
Name
Owned For
Owner Type
Purchase Details
Closed on
Jul 2, 2009
Sold by
Drieling James D and Drieling Trina L
Bought by
Drieling David M
Current Estimated Value
Home Financials for this Owner
Home Financials are based on the most recent Mortgage that was taken out on this home.
Original Mortgage
$86,602
Outstanding Balance
$56,551
Interest Rate
5.32%
Mortgage Type
FHA
Estimated Equity
$122,054
Purchase Details
Closed on
Jul 23, 1990
Bought by
Drieling James D
Create a Home Valuation Report for This Property
The Home Valuation Report is an in-depth analysis detailing your home's value as well as a comparison with similar homes in the area
Home Values in the Area
Average Home Value in this Area
Purchase History
| Date | Buyer | Sale Price | Title Company |
|---|---|---|---|
| Drieling David M | $88,200 | -- | |
| Drieling James D | $70,000 | -- |
Source: Public Records
Mortgage History
| Date | Status | Borrower | Loan Amount |
|---|---|---|---|
| Open | Drieling David M | $86,602 |
Source: Public Records
Tax History Compared to Growth
Tax History
| Year | Tax Paid | Tax Assessment Tax Assessment Total Assessment is a certain percentage of the fair market value that is determined by local assessors to be the total taxable value of land and additions on the property. | Land | Improvement |
|---|---|---|---|---|
| 2024 | $1,831 | $38,470 | $8,470 | $30,000 |
| 2023 | $1,831 | $38,470 | $8,470 | $30,000 |
| 2022 | $1,734 | $38,470 | $8,470 | $30,000 |
| 2021 | $1,478 | $29,580 | $6,510 | $23,070 |
| 2020 | $1,451 | $29,580 | $6,510 | $23,070 |
| 2019 | $1,458 | $29,580 | $6,510 | $23,070 |
| 2018 | $1,376 | $26,500 | $6,510 | $19,990 |
| 2017 | $1,392 | $26,500 | $6,510 | $19,990 |
| 2016 | $1,378 | $26,500 | $6,510 | $19,990 |
| 2015 | $1,358 | $25,490 | $6,270 | $19,220 |
| 2014 | $1,358 | $25,490 | $6,270 | $19,220 |
| 2013 | $1,362 | $25,490 | $6,270 | $19,220 |
Source: Public Records
Map
Nearby Homes