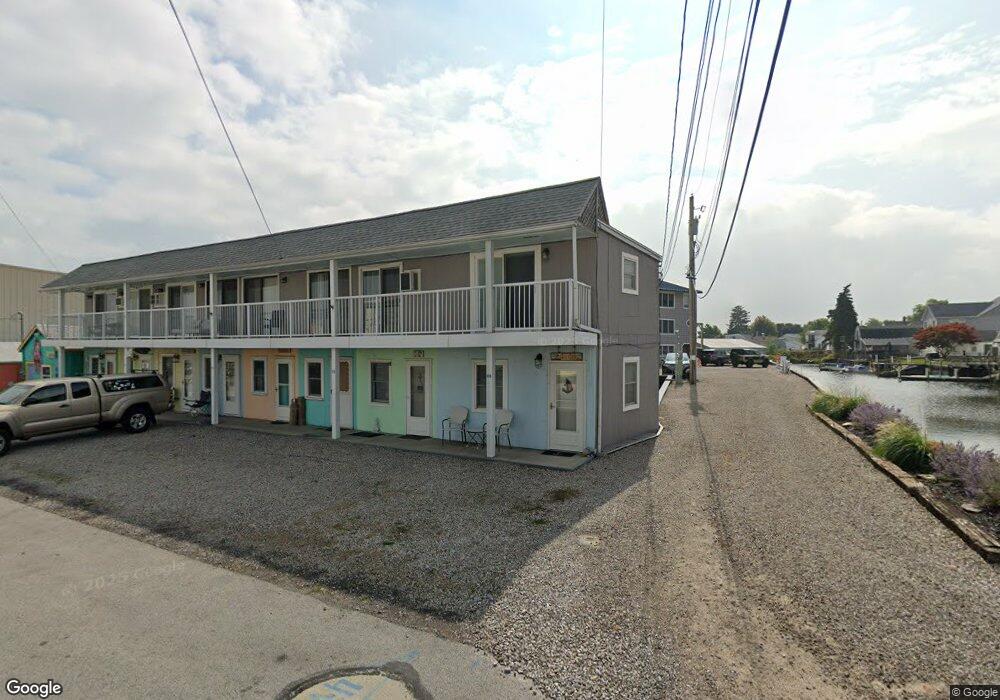
818 Curran St Sandusky, OH 44870
Estimated Value: $100,000 - $112,163
1
Bed
2
Baths
225
Sq Ft
$468/Sq Ft
Est. Value
About This Home
This home is located at 818 Curran St, Sandusky, OH 44870 and is currently estimated at $105,291, approximately $467 per square foot. 818 Curran St is a home located in Erie County with nearby schools including Sandusky High School, Monroe Preparatory Academy, and Sandusky Central Catholic School.
Ownership History
Date
Name
Owned For
Owner Type
Purchase Details
Closed on
May 21, 2024
Sold by
No Tell Boatel Llc
Bought by
Durkin Robert P
Current Estimated Value
Purchase Details
Closed on
Jun 6, 2018
Sold by
Stephens Craig M
Bought by
No Tell Boatel Llc
Purchase Details
Closed on
Mar 9, 2016
Sold by
Olivia Llc
Bought by
Cattien Llc
Purchase Details
Closed on
Nov 6, 1998
Sold by
Holdien Lynn A
Bought by
Stephens Craig M
Create a Home Valuation Report for This Property
The Home Valuation Report is an in-depth analysis detailing your home's value as well as a comparison with similar homes in the area
Home Values in the Area
Average Home Value in this Area
Purchase History
| Date | Buyer | Sale Price | Title Company |
|---|---|---|---|
| Durkin Robert P | $90,000 | None Listed On Document | |
| No Tell Boatel Llc | $50,000 | None Available | |
| Cattien Llc | $350,000 | Southern Title Of Ohio Ltd | |
| Stephens Craig M | $17,600 | -- |
Source: Public Records
Tax History Compared to Growth
Tax History
| Year | Tax Paid | Tax Assessment Tax Assessment Total Assessment is a certain percentage of the fair market value that is determined by local assessors to be the total taxable value of land and additions on the property. | Land | Improvement |
|---|---|---|---|---|
| 2024 | $587 | $14,899 | $5,106 | $9,793 |
| 2023 | $587 | $16,072 | $3,192 | $12,880 |
| 2022 | $815 | $16,075 | $3,192 | $12,883 |
| 2021 | $822 | $16,070 | $3,190 | $12,880 |
| 2020 | $734 | $13,180 | $3,190 | $9,990 |
| 2019 | $754 | $13,180 | $3,190 | $9,990 |
| 2018 | $755 | $13,180 | $3,190 | $9,990 |
| 2017 | $362 | $6,290 | $2,010 | $4,280 |
| 2016 | $361 | $6,290 | $2,010 | $4,280 |
| 2015 | $327 | $6,290 | $2,010 | $4,280 |
| 2014 | $325 | $6,290 | $2,010 | $4,280 |
| 2013 | $322 | $6,290 | $2,010 | $4,280 |
Source: Public Records
Map
Nearby Homes