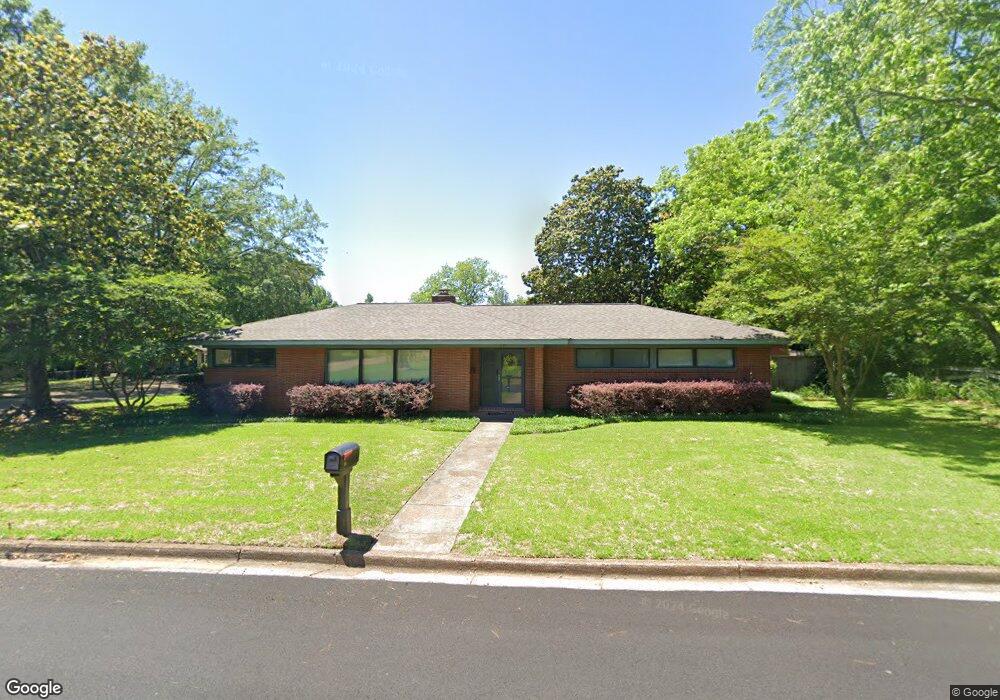
818 David St West Point, MS 39773
Estimated Value: $242,000 - $257,000
About This Home
This home is located at 818 David St, West Point, MS 39773 and is currently estimated at $252,601, approximately $89 per square foot. 818 David St is a home located in Clay County with nearby schools including East Side Elementary School, West Clay Elementary School, and Church Hill Elementary School.
Ownership History
We collect this data history from publicly available records. To have your information removed, we recommend requesting removal directly through your county’s website.
Purchase Details
Home Financials for this Owner
Home Financials are based on the most recent Mortgage that was taken out on this home.Purchase History
We collect this data history from publicly available records. To have your information removed, we recommend requesting removal directly through your county’s website.
| Date | Buyer | Sale Price | Title Company |
|---|---|---|---|
| -- | None Listed On Document |
Mortgage History
We collect this data history from publicly available records. To have your information removed, we recommend requesting removal directly through your county’s website.
| Date | Status | Borrower | Loan Amount |
|---|---|---|---|
| Open | $254,308 | ||
| Closed | $9,065 |
Tax History
We collect this data history from publicly available records. To have your information removed, we recommend requesting removal directly through your county’s website.
| Year | Tax Paid | Tax Assessment Tax Assessment Total Assessment is a certain percentage of the fair market value that is determined by local assessors to be the total taxable value of land and additions on the property. | Land | Improvement |
|---|---|---|---|---|
| 2025 | $762 | $16,280 | $1,414 | $14,866 |
| 2024 | $733 | $16,280 | $1,414 | $14,866 |
| 2023 | $1,740 | $13,633 | $1,414 | $12,219 |
| 2022 | $598 | $13,633 | $1,414 | $12,219 |
| 2021 | $595 | $13,633 | $1,414 | $12,219 |
| 2020 | $600 | $13,633 | $1,414 | $12,219 |
| 2019 | $545 | $13,521 | $1,414 | $12,107 |
| 2018 | $517 | $13,521 | $1,414 | $12,107 |
| 2017 | $517 | $13,521 | $1,414 | $12,107 |
| 2016 | $503 | $13,521 | $1,414 | $12,107 |
| 2015 | $458 | $12,185 | $1,414 | $10,771 |
| 2014 | $376 | $12,185 | $1,414 | $10,771 |
| 2013 | $376 | $12,185 | $1,414 | $10,771 |
Map
- 1414 E Brame Ave
- 229 Clark Cir
- 405 S Eshman Ave
- 170 Meadow Hill Rd
- 44 Torbert Dr
- 112 Meadow Hill Rd
- 472 S Eshman Ave
- 228 Mccord St
- 329 Converse Dr
- 389 Mapleview Rd
- 35 Rich St
- 341 Mccord St
- 355 Mccord St
- 264 Mapleview Rd
- 65 Calhoun St
- 98 Calhoun St
- 600 E Westbrook St
- 238 Calhoun St
- 74 Tom Bayne St
- Lot 2 Waverly Rd
Ask me questions while you tour the home.