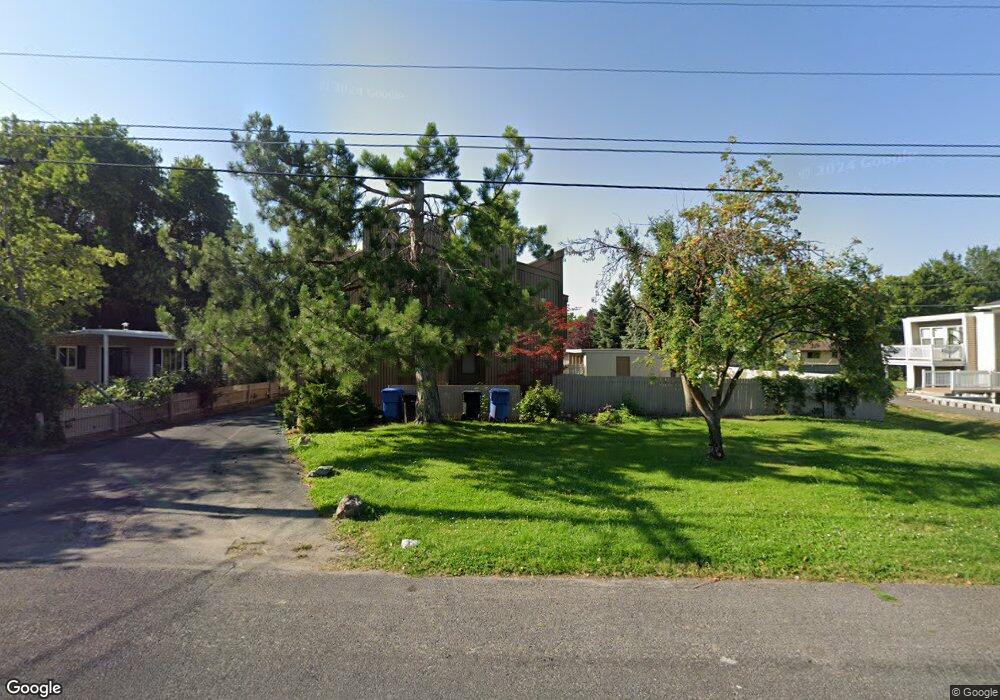
818 E 100 N Logan, UT 84321
Wilson NeighborhoodEstimated Value: $538,121 - $922,000
8
Beds
4
Baths
3,610
Sq Ft
$199/Sq Ft
Est. Value
About This Home
This home is located at 818 E 100 N, Logan, UT 84321 and is currently estimated at $719,280, approximately $199 per square foot. 818 E 100 N is a home located in Cache County with nearby schools including Wilson School, Mount Logan Middle School, and Logan High School.
Ownership History
Date
Name
Owned For
Owner Type
Purchase Details
Closed on
Oct 7, 2024
Sold by
G Wayne Miller Llc
Bought by
G Wayne Miller Ii Llc
Current Estimated Value
Purchase Details
Closed on
May 15, 2012
Sold by
Miller G Wayne
Bought by
G Wayne Miller Llc
Purchase Details
Closed on
Apr 2, 2012
Sold by
Miller G Wayne
Bought by
Miller G Wayne
Purchase Details
Closed on
Mar 31, 2012
Sold by
Richards Adam H and Richards Hillary H
Bought by
Miller Wayne G
Purchase Details
Closed on
Mar 29, 2005
Sold by
Richards Adam
Bought by
Richards Adam H and Richards Hillary H
Home Financials for this Owner
Home Financials are based on the most recent Mortgage that was taken out on this home.
Original Mortgage
$47,000
Interest Rate
5.6%
Mortgage Type
Credit Line Revolving
Purchase Details
Closed on
Jan 17, 2002
Sold by
Ibis Enterprises Llc
Bought by
Cook Richard M and Cook Karon C
Create a Home Valuation Report for This Property
The Home Valuation Report is an in-depth analysis detailing your home's value as well as a comparison with similar homes in the area
Home Values in the Area
Average Home Value in this Area
Purchase History
| Date | Buyer | Sale Price | Title Company |
|---|---|---|---|
| G Wayne Miller Ii Llc | -- | Hickman Land Title | |
| G Wayne Miller Llc | -- | Hickman Land Title Company | |
| Miller G Wayne | -- | Hickman Land Title Company | |
| Miller Wayne G | -- | Hickman Land Title Company | |
| Richards Adam H | -- | American Secure Title | |
| Cook Richard M | -- | Cache Title Company |
Source: Public Records
Mortgage History
| Date | Status | Borrower | Loan Amount |
|---|---|---|---|
| Previous Owner | Richards Adam H | $47,000 |
Source: Public Records
Tax History
| Year | Tax Paid | Tax Assessment Tax Assessment Total Assessment is a certain percentage of the fair market value that is determined by local assessors to be the total taxable value of land and additions on the property. | Land | Improvement |
|---|---|---|---|---|
| 2025 | $3,047 | $716,400 | $178,500 | $537,900 |
| 2024 | $3,145 | $716,400 | $178,500 | $537,900 |
| 2023 | $3,284 | $712,900 | $175,000 | $537,900 |
| 2022 | $352 | $712,900 | $175,000 | $537,900 |
| 2021 | $3,607 | $621,400 | $132,400 | $489,000 |
| 2020 | $2,687 | $416,500 | $90,000 | $326,500 |
| 2019 | $2,808 | $416,500 | $90,000 | $326,500 |
| 2018 | $3,052 | $413,280 | $70,000 | $343,280 |
| 2017 | $2,892 | $207,075 | $0 | $0 |
| 2016 | $2,998 | $127,545 | $0 | $0 |
| 2015 | $1,849 | $127,545 | $0 | $0 |
| 2014 | $1,671 | $127,545 | $0 | $0 |
| 2013 | -- | $113,015 | $0 | $0 |
Source: Public Records
Map
Nearby Homes
- 70 River Pointe Dr
- 28 River Pointe Dr
- 664 E Center St
- 45 River Circle Dr
- 684 Apple Dr
- 2758 N Canyon Cove Dr
- 2738 N Canyon Cove Dr
- 622 Canyon Rd
- 1164 E Mountain Rd
- 74 Canterbury Cir
- 1034 Thrushwood Dr
- 545 E Boulevard St
- 1045 Fox Farm Rd
- 227 N 400 E
- 1147 Eastridge Dr
- 426 E 200 S
- 331 N 400 E
- 440 N 400 E
- 128 S 1170 E
- 665 E 400 S
Your Personal Tour Guide
Ask me questions while you tour the home.