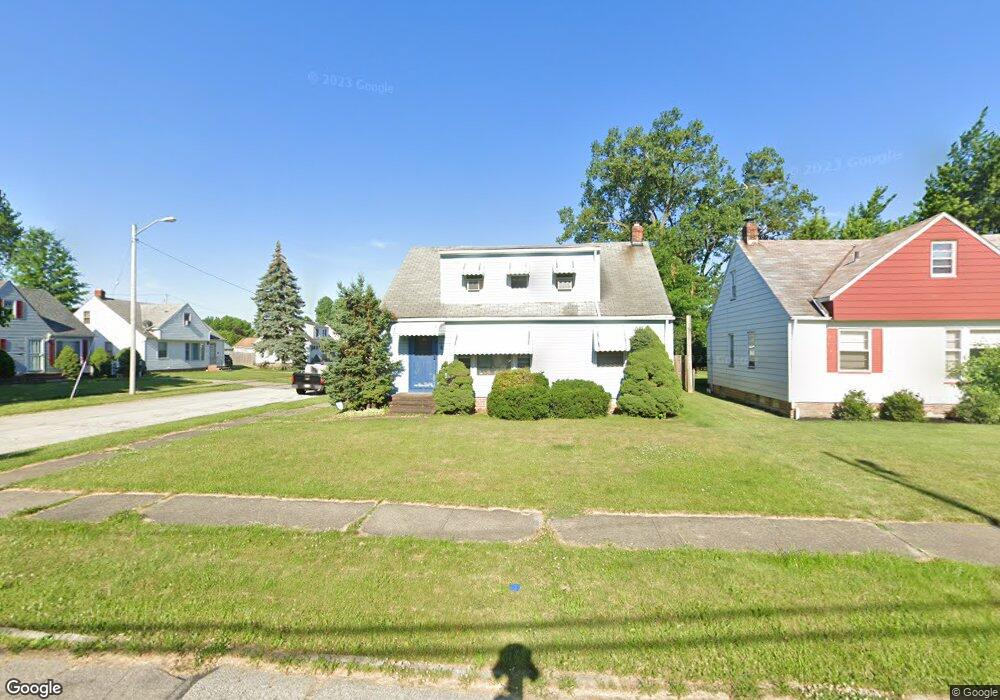
818 E 249th St Euclid, OH 44123
Estimated Value: $144,777 - $171,000
4
Beds
2
Baths
1,521
Sq Ft
$107/Sq Ft
Est. Value
About This Home
This home is located at 818 E 249th St, Euclid, OH 44123 and is currently estimated at $162,444, approximately $106 per square foot. 818 E 249th St is a home located in Cuyahoga County with nearby schools including Bluestone Elementary School, Euclid High School, and Ss Robert & William Catholic School.
Ownership History
Date
Name
Owned For
Owner Type
Purchase Details
Closed on
Jan 26, 2005
Sold by
Dominick Joseph G and Dominick Suzanne
Bought by
Green Carol M
Current Estimated Value
Home Financials for this Owner
Home Financials are based on the most recent Mortgage that was taken out on this home.
Original Mortgage
$118,800
Outstanding Balance
$60,464
Interest Rate
5.77%
Mortgage Type
Purchase Money Mortgage
Estimated Equity
$101,980
Purchase Details
Closed on
Apr 2, 1985
Sold by
Dominick Joseph G
Bought by
Dominick Joseph G and Dominick Suzanne
Purchase Details
Closed on
Aug 15, 1980
Sold by
Bobertson Charles R
Bought by
Dominick Joseph G
Purchase Details
Closed on
Nov 4, 1977
Sold by
Bennett Clark W and Bennett Patricia A
Bought by
Bobertson Charles R
Purchase Details
Closed on
Jan 1, 1975
Bought by
Bennett Clark W and Bennett Patricia A
Create a Home Valuation Report for This Property
The Home Valuation Report is an in-depth analysis detailing your home's value as well as a comparison with similar homes in the area
Home Values in the Area
Average Home Value in this Area
Purchase History
| Date | Buyer | Sale Price | Title Company |
|---|---|---|---|
| Green Carol M | $122,500 | -- | |
| Dominick Joseph G | -- | -- | |
| Dominick Joseph G | $56,500 | -- | |
| Bobertson Charles R | $44,000 | -- | |
| Bennett Clark W | -- | -- |
Source: Public Records
Mortgage History
| Date | Status | Borrower | Loan Amount |
|---|---|---|---|
| Open | Green Carol M | $118,800 |
Source: Public Records
Tax History
| Year | Tax Paid | Tax Assessment Tax Assessment Total Assessment is a certain percentage of the fair market value that is determined by local assessors to be the total taxable value of land and additions on the property. | Land | Improvement |
|---|---|---|---|---|
| 2024 | $3,421 | $48,930 | $9,345 | $39,585 |
| 2023 | $3,009 | $34,200 | $7,110 | $27,090 |
| 2022 | $2,942 | $34,200 | $7,110 | $27,090 |
| 2021 | $3,281 | $34,200 | $7,110 | $27,090 |
| 2020 | $3,112 | $29,470 | $6,130 | $23,350 |
| 2019 | $2,743 | $84,200 | $17,500 | $66,700 |
| 2018 | $2,737 | $29,470 | $6,130 | $23,350 |
| 2017 | $2,932 | $26,080 | $5,080 | $21,000 |
| 2016 | $2,939 | $26,080 | $5,080 | $21,000 |
| 2015 | $2,674 | $26,080 | $5,080 | $21,000 |
| 2014 | $2,674 | $26,080 | $5,080 | $21,000 |
Source: Public Records
Map
Nearby Homes
- 890 E 250th St
- 24431 Hartland Rd
- 797 Babbitt Rd Unit 15
- 825 E 256th St
- 25650 Richards Ave
- 515 E 250th St
- 24791 Drakefield Ave
- 25700 Briardale Ave
- 23298 Williams Ave
- 25751 Briardale Ave
- 464 E 250th St
- 521 Kenwood Dr Unit B-5
- 22751 Fox Ave
- 25401 Farringdon Ave
- 24891 Zeman Ave
- 328 E 238th St
- 25151 Zeman Ave
- 25671 Farringdon Ave
- 450 Kenwood Dr Unit D-12
- 450 Kenwood Dr Unit E12
- 812 E 249th St
- 808 E 249th St
- 24601 Alberton Rd
- 804 E 249th St
- 24670 Alberton Rd
- 24700 Alberton Rd
- 24630 Alberton Rd
- 24600 Alberton Rd
- 24531 Alberton Rd
- 800 E 249th St
- 24570 Alberton Rd
- 823 E 249th St
- 819 E 249th St
- 24600 Glenforest Rd
- 809 E 249th St
- 827 E 249th St
- 24501 Alberton Rd
- 24530 Alberton Rd
- 24570 Glenforest Rd
- 796 E 249th St
Your Personal Tour Guide
Ask me questions while you tour the home.