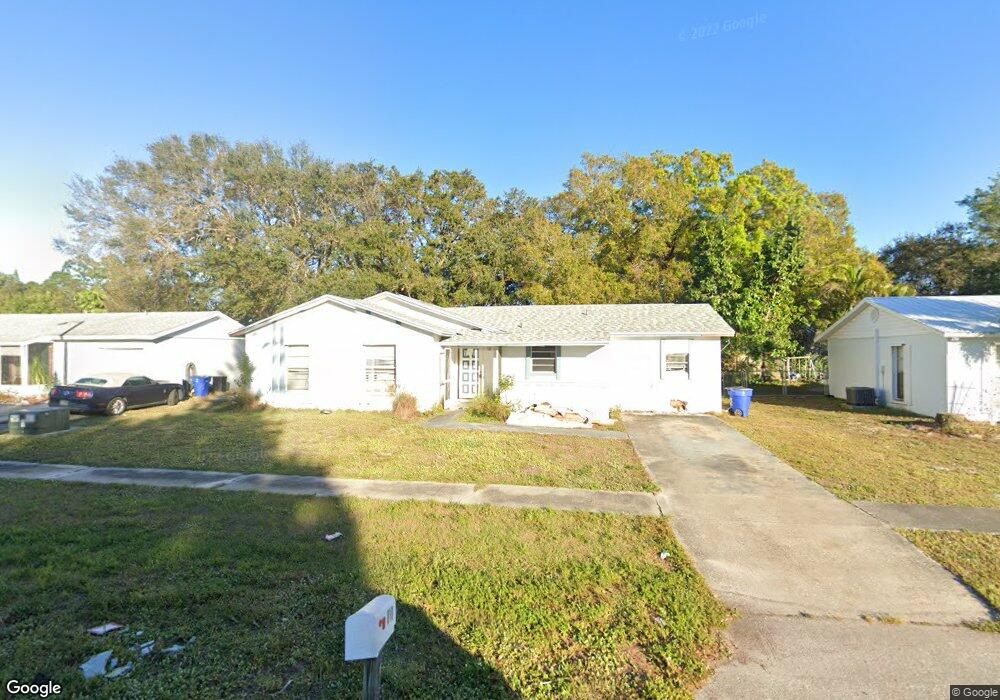
818 Friendly St North Fort Myers, FL 33903
Hancock NeighborhoodEstimated Value: $208,000 - $256,000
3
Beds
2
Baths
1,529
Sq Ft
$152/Sq Ft
Est. Value
About This Home
This home is located at 818 Friendly St, North Fort Myers, FL 33903 and is currently estimated at $232,049, approximately $151 per square foot. 818 Friendly St is a home located in Lee County with nearby schools including Tropic Isles Elementary School, Hancock Creek Elementary School, and Caloosa Elementary School.
Ownership History
Date
Name
Owned For
Owner Type
Purchase Details
Closed on
May 12, 2016
Sold by
Schillinger Josph A
Bought by
Schillinger Joseph A and North Rock Trust
Current Estimated Value
Purchase Details
Closed on
May 27, 2015
Sold by
Mchugh Larry W
Bought by
North Rock Trust
Purchase Details
Closed on
Mar 20, 2008
Sold by
Southern Living Rvp Llc
Bought by
Mchugh Larry W and Mchugh Teresa A
Home Financials for this Owner
Home Financials are based on the most recent Mortgage that was taken out on this home.
Original Mortgage
$104,362
Interest Rate
6.22%
Mortgage Type
FHA
Purchase Details
Closed on
Jul 17, 2007
Sold by
Fabina Vicki L
Bought by
Southern Living Rvp Llc
Purchase Details
Closed on
Jul 31, 2001
Sold by
Starr Pamela M and Klick Scott A
Bought by
Fabina Vicki
Home Financials for this Owner
Home Financials are based on the most recent Mortgage that was taken out on this home.
Original Mortgage
$70,288
Interest Rate
7.19%
Mortgage Type
FHA
Create a Home Valuation Report for This Property
The Home Valuation Report is an in-depth analysis detailing your home's value as well as a comparison with similar homes in the area
Home Values in the Area
Average Home Value in this Area
Purchase History
| Date | Buyer | Sale Price | Title Company |
|---|---|---|---|
| Schillinger Joseph A | -- | None Available | |
| North Rock Trust | $75,100 | None Available | |
| Mchugh Larry W | $106,000 | Security Title & Trust Inc | |
| Southern Living Rvp Llc | $94,000 | None Available | |
| Fabina Vicki | $71,600 | -- |
Source: Public Records
Mortgage History
| Date | Status | Borrower | Loan Amount |
|---|---|---|---|
| Previous Owner | Mchugh Larry W | $104,362 | |
| Previous Owner | Fabina Vicki | $70,288 |
Source: Public Records
Tax History Compared to Growth
Tax History
| Year | Tax Paid | Tax Assessment Tax Assessment Total Assessment is a certain percentage of the fair market value that is determined by local assessors to be the total taxable value of land and additions on the property. | Land | Improvement |
|---|---|---|---|---|
| 2025 | $2,780 | $158,631 | -- | -- |
| 2024 | $2,715 | $144,210 | -- | -- |
| 2023 | $2,715 | $131,100 | $0 | $0 |
| 2022 | $2,396 | $119,182 | $0 | $0 |
| 2021 | $2,021 | $124,583 | $22,729 | $101,854 |
| 2020 | $1,903 | $114,658 | $16,688 | $97,970 |
| 2019 | $1,770 | $106,589 | $6,608 | $99,981 |
| 2018 | $1,626 | $92,055 | $6,608 | $85,447 |
| 2017 | $1,642 | $100,939 | $6,608 | $94,331 |
| 2016 | $1,293 | $67,275 | $8,132 | $59,143 |
| 2015 | $408 | $56,804 | $7,012 | $49,792 |
| 2014 | -- | $54,897 | $6,675 | $48,222 |
| 2013 | -- | $48,105 | $5,866 | $42,239 |
Source: Public Records
Map
Nearby Homes
- 935 Hearty St
- 947 Jolly Rd
- 0 Happy Dale Rd Unit 2025008482
- 888 Ridgeway Dr
- 1010 Tropic Terrace
- 1003 Tropic Terrace
- 1082 Ridgeway Dr
- 927 Coconut Dr
- 857 Pangola Dr
- 1429 Tropic Terrace
- 1409 Tropic Terrace
- 1418 Tropic Terrace
- 1432 Tropic Terrace Unit PS32
- 1416 Tropic Terrace
- 938 Tropical Palm Ave
- 4930 Orange Grove Blvd
- 1517 Tropic Terrace
- 1525 Tropic Terrace Unit 1500
- 1507 Tropic Terrace
- 1516 Tropic Terrace
- 824 Friendly St
- 812 Friendly St
- 830 Friendly St
- 806 Friendly St
- 817 Friendly St
- 823 Friendly St
- 811 Friendly St
- 829 Friendly St
- 805 Friendly St
- 800 Friendly St
- 836 Friendly St
- 923 Hearty St
- 929 Hearty St
- 905 Jolly Rd
- 799 Friendly St
- 917 Hearty St
- 794 Friendly St
- 958 Happy Ct
- 954 Happy Ct
- 911 Hearty St