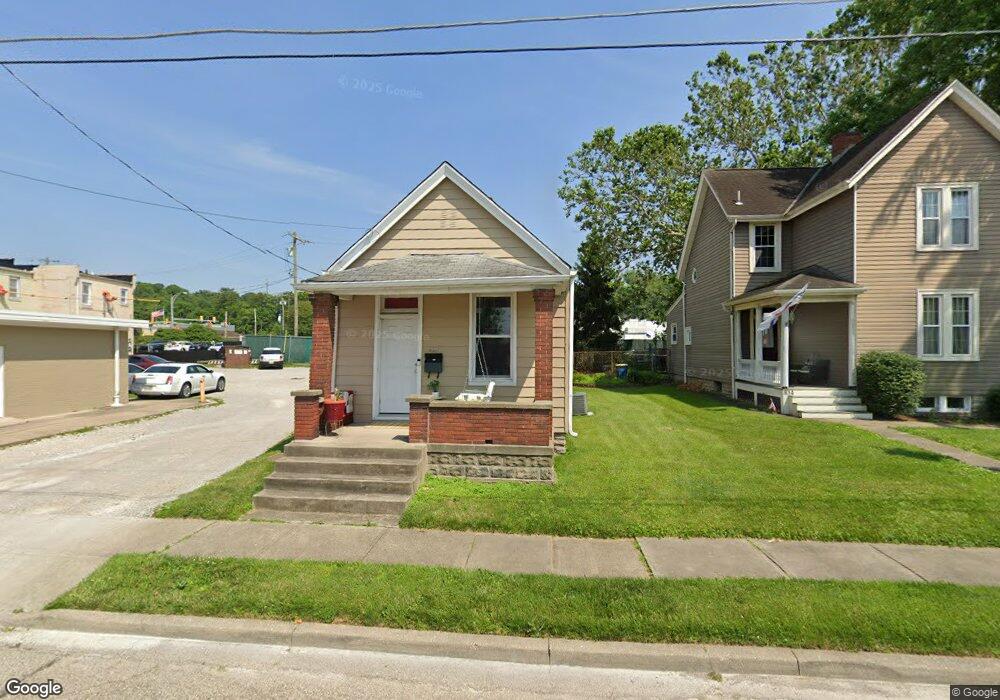
818 Jenny Lind St Cincinnati, OH 45215
Estimated Value: $108,000 - $169,000
1
Bed
1
Bath
864
Sq Ft
$154/Sq Ft
Est. Value
About This Home
This home is located at 818 Jenny Lind St, Cincinnati, OH 45215 and is currently estimated at $133,149, approximately $154 per square foot. 818 Jenny Lind St is a home with nearby schools including Reading Community High School, Saints Peter and Paul Academy, and Mount Notre Dame High School.
Ownership History
Date
Name
Owned For
Owner Type
Purchase Details
Closed on
Jul 24, 2024
Sold by
Burkel Tami L
Bought by
19137 Wb Jenny Lind Llc
Current Estimated Value
Purchase Details
Closed on
Sep 13, 2005
Sold by
Burkel Thomas L
Bought by
Burkel Tami L
Purchase Details
Closed on
Nov 20, 2003
Sold by
Feldhaus Omer J and Feldhaus Ruth M
Bought by
Burkel Thomas L and Burkel Tami L
Create a Home Valuation Report for This Property
The Home Valuation Report is an in-depth analysis detailing your home's value as well as a comparison with similar homes in the area
Home Values in the Area
Average Home Value in this Area
Purchase History
| Date | Buyer | Sale Price | Title Company |
|---|---|---|---|
| 19137 Wb Jenny Lind Llc | -- | None Listed On Document | |
| Burkel Tami L | -- | None Available | |
| Burkel Thomas L | $50,000 | -- |
Source: Public Records
Tax History Compared to Growth
Tax History
| Year | Tax Paid | Tax Assessment Tax Assessment Total Assessment is a certain percentage of the fair market value that is determined by local assessors to be the total taxable value of land and additions on the property. | Land | Improvement |
|---|---|---|---|---|
| 2024 | $1,439 | $26,510 | $7,165 | $19,345 |
| 2023 | $1,436 | $26,510 | $7,165 | $19,345 |
| 2022 | $1,315 | $18,845 | $5,758 | $13,087 |
| 2021 | $1,126 | $18,845 | $5,758 | $13,087 |
| 2020 | $1,110 | $18,845 | $5,758 | $13,087 |
| 2019 | $1,081 | $16,678 | $5,096 | $11,582 |
| 2018 | $1,082 | $16,678 | $5,096 | $11,582 |
| 2017 | $1,033 | $16,678 | $5,096 | $11,582 |
| 2016 | $1,163 | $18,617 | $5,401 | $13,216 |
| 2015 | $1,157 | $18,617 | $5,401 | $13,216 |
| 2014 | $1,017 | $18,617 | $5,401 | $13,216 |
| 2013 | $1,030 | $18,995 | $5,509 | $13,486 |
Source: Public Records
Map
Nearby Homes