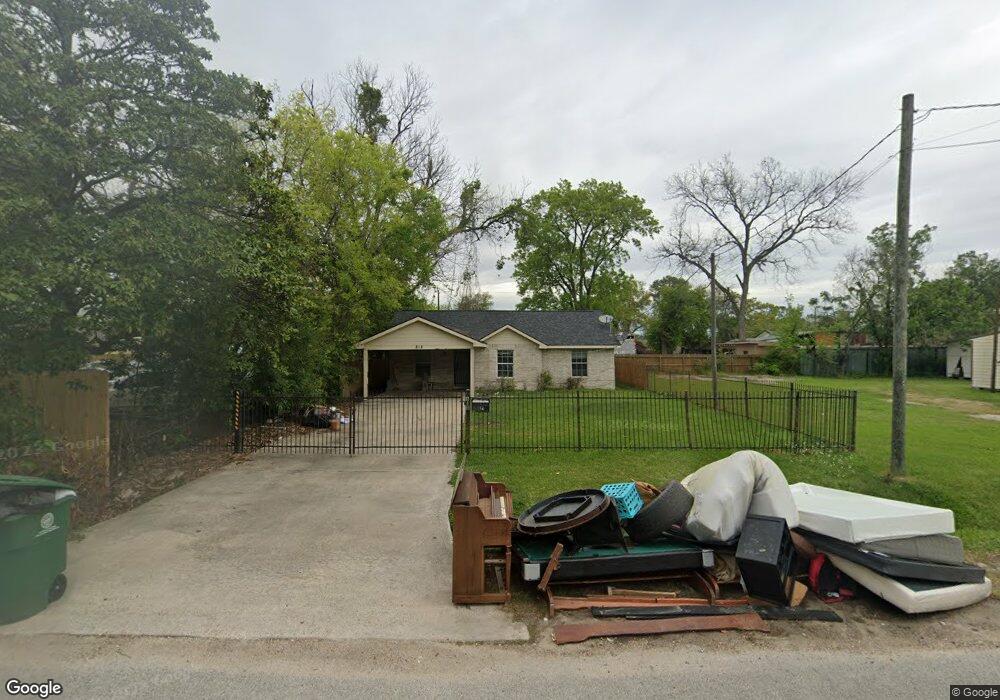
818 Lucky St Houston, TX 77088
Acres Homes NeighborhoodEstimated Value: $186,000 - $270,000
3
Beds
2
Baths
1,312
Sq Ft
$173/Sq Ft
Est. Value
About This Home
This home is located at 818 Lucky St, Houston, TX 77088 and is currently estimated at $226,970, approximately $172 per square foot. 818 Lucky St is a home located in Harris County with nearby schools including Wesley Elementary School, Williams Middle, and Booker T Washington Sr High.
Ownership History
Date
Name
Owned For
Owner Type
Purchase Details
Closed on
May 27, 2008
Sold by
Cebrun Michael
Bought by
Cebrun Carver L
Current Estimated Value
Home Financials for this Owner
Home Financials are based on the most recent Mortgage that was taken out on this home.
Original Mortgage
$70,200
Outstanding Balance
$44,677
Interest Rate
5.89%
Mortgage Type
Stand Alone Refi Refinance Of Original Loan
Estimated Equity
$182,293
Purchase Details
Closed on
Oct 9, 2003
Sold by
Phillips John L and Phillips Lena Mae
Bought by
Cebrun Michael
Create a Home Valuation Report for This Property
The Home Valuation Report is an in-depth analysis detailing your home's value as well as a comparison with similar homes in the area
Home Values in the Area
Average Home Value in this Area
Purchase History
| Date | Buyer | Sale Price | Title Company |
|---|---|---|---|
| Cebrun Carver L | -- | Startex Title Company | |
| Cebrun Michael | -- | -- |
Source: Public Records
Mortgage History
| Date | Status | Borrower | Loan Amount |
|---|---|---|---|
| Open | Cebrun Carver L | $70,200 |
Source: Public Records
Tax History Compared to Growth
Tax History
| Year | Tax Paid | Tax Assessment Tax Assessment Total Assessment is a certain percentage of the fair market value that is determined by local assessors to be the total taxable value of land and additions on the property. | Land | Improvement |
|---|---|---|---|---|
| 2025 | $3,671 | $159,272 | $73,062 | $86,210 |
| 2024 | $3,671 | $175,464 | $73,062 | $102,402 |
| 2023 | $3,671 | $176,776 | $73,062 | $103,714 |
| 2022 | $3,242 | $147,236 | $57,024 | $90,212 |
| 2021 | $2,796 | $119,987 | $37,422 | $82,565 |
| 2020 | $2,619 | $108,172 | $32,076 | $76,096 |
| 2019 | $2,671 | $105,536 | $28,512 | $77,024 |
| 2018 | $2,286 | $90,358 | $16,038 | $74,320 |
| 2017 | $1,528 | $60,445 | $10,692 | $49,753 |
| 2016 | $1,528 | $60,445 | $10,692 | $49,753 |
| 2015 | $1,514 | $58,906 | $10,692 | $48,214 |
| 2014 | $1,514 | $58,906 | $10,692 | $48,214 |
Source: Public Records
Map
Nearby Homes