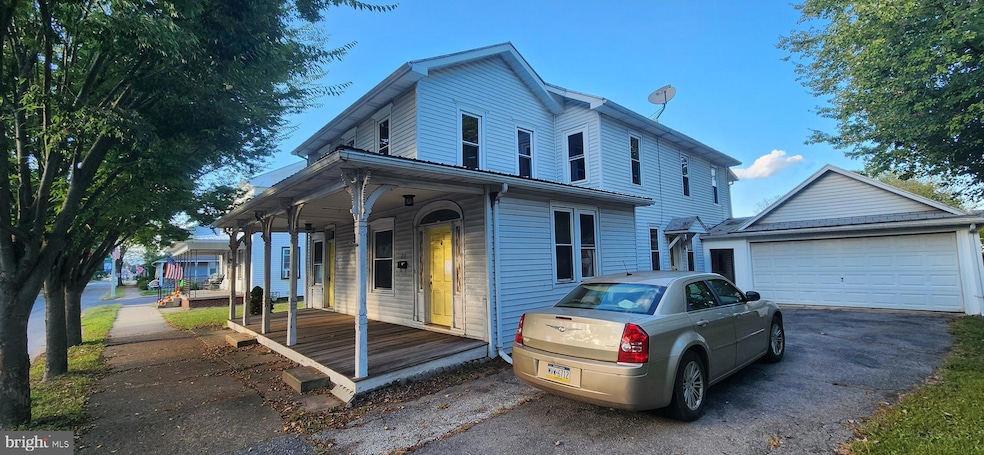
818 Main St Unit 820 Watsontown, PA 17777
Estimated payment $942/month
Highlights
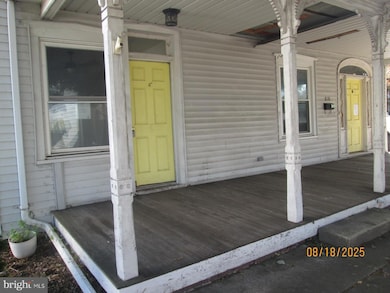
- Craftsman Architecture
- 2 Car Attached Garage
- Forced Air Heating and Cooling System
- No HOA
About This Home
With a little bit of elbow grease, time and your imagination you can bring this house back to its former glory.
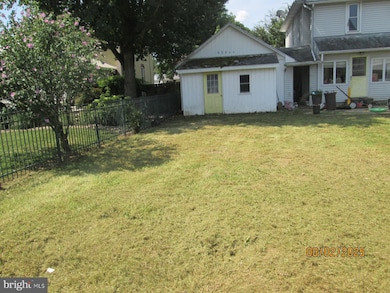
Space, space and more space! This house just keeps on going! One of the few houses on Main street with a front driveway and garage and absolutely ideal for the local parades and yard sale events. Spacious and functional first floor with open eat in kitchen and a great view of the yard through the back windows. Formal dining, office nook, large living room and 3/4 bath/laundry all on the first floor! 3 stair cases
Listing Agent
(717) 932-2599 tstewart@cavalryrealty.com Cavalry Realty LLC License #RM420558 Listed on: 09/25/2025
Home Details
Home Type
- Single Family
Est. Annual Taxes
- $2,124
Year Built
- Built in 1900
Parking
- 2 Car Attached Garage
- 2 Driveway Spaces
- Front Facing Garage
- On-Street Parking
Home Design
- Craftsman Architecture
- Fixer Upper
- Permanent Foundation
- Frame Construction
- Batts Insulation
- Metal Roof
- CPVC or PVC Pipes
- Asphalt
Interior Spaces
- 2,704 Sq Ft Home
- Property has 2 Levels
- Basement Fills Entire Space Under The House
Bedrooms and Bathrooms
- 4 Bedrooms
- 2 Full Bathrooms
Schools
- Warrior Run High School
Utilities
- Forced Air Heating and Cooling System
- Electric Water Heater
- Municipal Trash
Additional Features
- 9,147 Sq Ft Lot
- Flood Risk
Community Details
- No Home Owners Association
Listing and Financial Details
- Assessor Parcel Number 061-01-002-095
Map
Home Values in the Area
Average Home Value in this Area
Tax History
| Year | Tax Paid | Tax Assessment Tax Assessment Total Assessment is a certain percentage of the fair market value that is determined by local assessors to be the total taxable value of land and additions on the property. | Land | Improvement |
|---|---|---|---|---|
| 2025 | $2,205 | $16,300 | $1,700 | $14,600 |
| 2024 | $2,013 | $16,300 | $1,700 | $14,600 |
| 2023 | $2,013 | $16,300 | $1,700 | $14,600 |
| 2022 | $1,978 | $16,300 | $1,700 | $14,600 |
| 2021 | $1,939 | $16,300 | $1,700 | $14,600 |
| 2020 | $1,915 | $16,300 | $1,700 | $14,600 |
| 2019 | $1,879 | $16,300 | $1,700 | $14,600 |
| 2018 | $1,866 | $16,300 | $1,700 | $14,600 |
| 2017 | $1,777 | $16,300 | $1,700 | $14,600 |
| 2016 | -- | $16,300 | $1,700 | $14,600 |
| 2015 | -- | $16,300 | $1,700 | $14,600 |
| 2014 | -- | $16,300 | $1,700 | $14,600 |
Property History
| Date | Event | Price | List to Sale | Price per Sq Ft |
|---|---|---|---|---|
| 10/27/2025 10/27/25 | Price Changed | $144,900 | -6.5% | $54 / Sq Ft |
| 09/25/2025 09/25/25 | For Sale | $154,900 | -- | $57 / Sq Ft |
Purchase History
| Date | Type | Sale Price | Title Company |
|---|---|---|---|
| Sheriffs Deed | $1,821 | None Listed On Document | |
| Sheriffs Deed | $1,821 | None Listed On Document | |
| Deed | $181,900 | None Available | |
| Deed | $72,000 | None Available |
Mortgage History
| Date | Status | Loan Amount | Loan Type |
|---|---|---|---|
| Previous Owner | $183,737 | New Conventional |
Source: Bright MLS
MLS Number: PANU2002686
APN: 061-01-002-095
Disclaimer: Certain information contained herein is derived from information provided by parties other than Homes.com. All information provided is deemed reliable, but is not guaranteed to be accurate and should be independently verified.
![]() The data relating to real estate for sale on this website appears in part through the BRIGHT Internet Data Exchange program, a voluntary cooperative exchange of property listing data between licensed real estate brokerage firms, and is provided by BRIGHT through a licensing agreement.
The data relating to real estate for sale on this website appears in part through the BRIGHT Internet Data Exchange program, a voluntary cooperative exchange of property listing data between licensed real estate brokerage firms, and is provided by BRIGHT through a licensing agreement.
Listing information is from various brokers who participate in the Bright MLS IDX program and not all listings may be visible on the site.
The property information being provided on or through the website is for the personal, non-commercial use of consumers and such information may not be used for any purpose other than to identify prospective properties consumers may be interested in purchasing.
Some properties which appear for sale on the website may no longer be available because they are for instance, under contract, sold or are no longer being offered for sale.
Property information displayed is deemed reliable but is not guaranteed.
Copyright 2025 Bright MLS, Inc.
- 813 Elm St
- 5 W 7th St
- 215 E 8th St
- 115 E 4th St
- 21 Main St
- 15429 U S 15
- 159 Grandview Dr
- 397 N Hill Rd
- 0 Fornwalt Ln Unit 20-100886
- 0 Us Route 15 Hwy
- 2695 Turbot Ave
- 1822 White Deer Pike
- 246 Bridge Ave
- 261 Delaware Dr
- 7 Alvira Ct
- 2860 8th Street Dr
- 0 Voris Ln
- 4 Blue Jay Dr
- 2498 Susquehanna Trail
- 0 Susquehanna Trail
