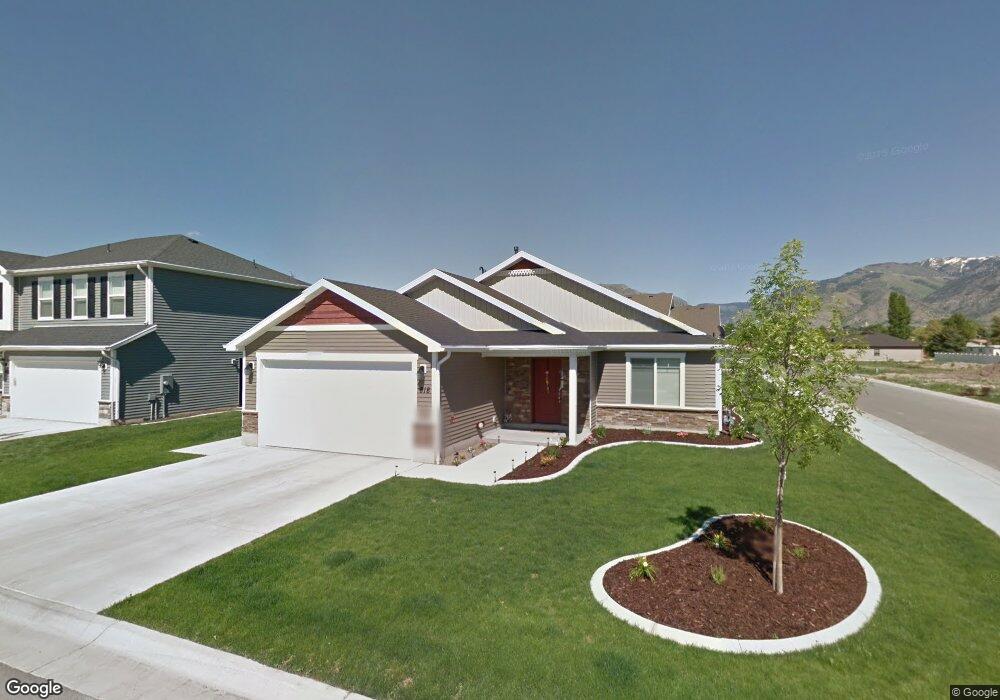
818 N 480 W Logan, UT 84321
Bridger NeighborhoodEstimated Value: $372,000 - $406,000
3
Beds
2
Baths
1,197
Sq Ft
$326/Sq Ft
Est. Value
About This Home
This home is located at 818 N 480 W, Logan, UT 84321 and is currently estimated at $390,781, approximately $326 per square foot. 818 N 480 W is a home located in Cache County with nearby schools including Bridger School, Mount Logan Middle School, and Logan High School.
Ownership History
Date
Name
Owned For
Owner Type
Purchase Details
Closed on
May 24, 2022
Sold by
Tye Harrison
Bought by
Logan 818 North 480 West Llc
Current Estimated Value
Purchase Details
Closed on
Feb 21, 2017
Sold by
Flippence Austin
Bought by
Harrison Tye
Home Financials for this Owner
Home Financials are based on the most recent Mortgage that was taken out on this home.
Original Mortgage
$128,500
Interest Rate
4.19%
Mortgage Type
New Conventional
Purchase Details
Closed on
Jul 30, 2012
Sold by
Visionary Homes Llc
Bought by
Flippence Austin L
Home Financials for this Owner
Home Financials are based on the most recent Mortgage that was taken out on this home.
Original Mortgage
$6,973
Interest Rate
3.62%
Mortgage Type
Stand Alone Second
Purchase Details
Closed on
Apr 27, 2012
Sold by
Ashbury Court Development 2 Llc
Bought by
Visionary Homes Llc
Home Financials for this Owner
Home Financials are based on the most recent Mortgage that was taken out on this home.
Original Mortgage
$116,000
Interest Rate
4.05%
Mortgage Type
Construction
Create a Home Valuation Report for This Property
The Home Valuation Report is an in-depth analysis detailing your home's value as well as a comparison with similar homes in the area
Home Values in the Area
Average Home Value in this Area
Purchase History
| Date | Buyer | Sale Price | Title Company |
|---|---|---|---|
| Logan 818 North 480 West Llc | -- | Whiting Eric B | |
| Logan 818 North 480 West Llc | -- | Whiting Eric B | |
| Harrison Tye | -- | None Available | |
| Flippence Austin L | -- | Cache Title Company | |
| Visionary Homes Llc | -- | Cache Title Company |
Source: Public Records
Mortgage History
| Date | Status | Borrower | Loan Amount |
|---|---|---|---|
| Previous Owner | Harrison Tye | $128,500 | |
| Previous Owner | Flippence Austin L | $6,973 | |
| Previous Owner | Flippence Austin L | $148,286 | |
| Previous Owner | Visionary Homes Llc | $116,000 |
Source: Public Records
Tax History Compared to Growth
Tax History
| Year | Tax Paid | Tax Assessment Tax Assessment Total Assessment is a certain percentage of the fair market value that is determined by local assessors to be the total taxable value of land and additions on the property. | Land | Improvement |
|---|---|---|---|---|
| 2025 | $1,639 | $211,915 | $0 | $0 |
| 2024 | $1,692 | $211,915 | $0 | $0 |
| 2023 | $1,767 | $211,035 | $0 | $0 |
| 2022 | $1,893 | $211,035 | $0 | $0 |
| 2021 | $1,249 | $215,236 | $42,000 | $173,236 |
| 2020 | $1,243 | $192,640 | $42,000 | $150,640 |
| 2019 | $1,299 | $192,640 | $42,000 | $150,640 |
| 2018 | $1,303 | $176,500 | $42,000 | $134,500 |
| 2017 | $1,354 | $96,965 | $0 | $0 |
| 2016 | $1,404 | $85,580 | $0 | $0 |
| 2015 | $1,241 | $85,580 | $0 | $0 |
| 2014 | $1,121 | $85,580 | $0 | $0 |
| 2013 | -- | $85,580 | $0 | $0 |
Source: Public Records
Map
Nearby Homes