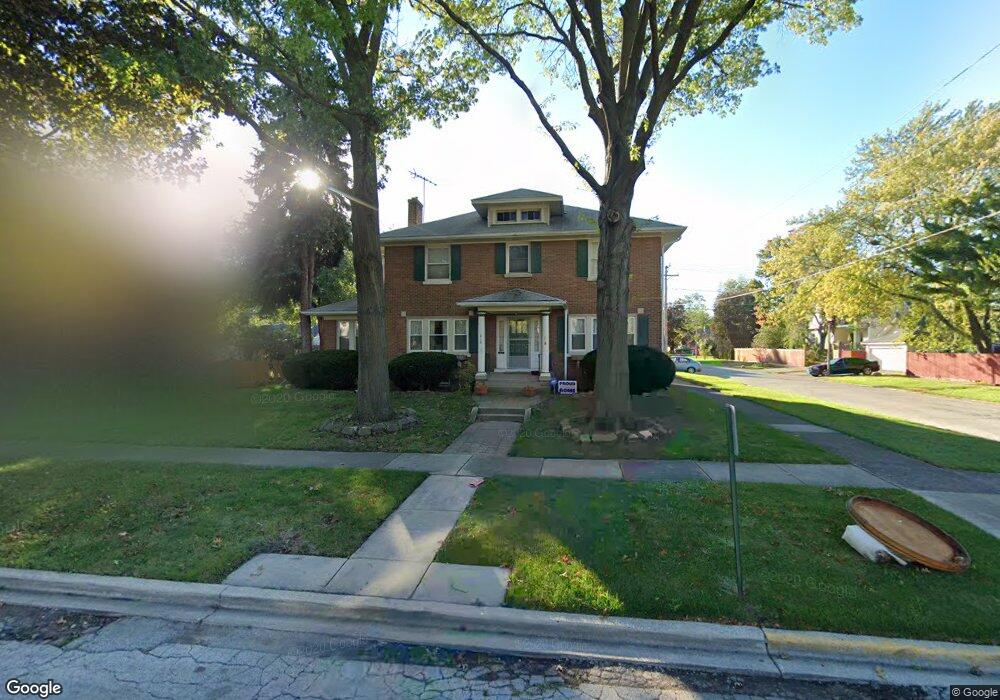
818 N 4th Ave Maywood, IL 60153
North Maywood NeighborhoodEstimated Value: $378,000 - $432,000
4
Beds
2
Baths
2,348
Sq Ft
$169/Sq Ft
Est. Value
About This Home
This home is located at 818 N 4th Ave, Maywood, IL 60153 and is currently estimated at $395,998, approximately $168 per square foot. 818 N 4th Ave is a home located in Cook County with nearby schools including Lincoln Elementary School, Stevenson Middle School, and Proviso East High School.
Ownership History
Date
Name
Owned For
Owner Type
Purchase Details
Closed on
Jun 14, 2002
Sold by
Krefft David and Krefft Lisa M
Bought by
Rankins Jerry
Current Estimated Value
Home Financials for this Owner
Home Financials are based on the most recent Mortgage that was taken out on this home.
Original Mortgage
$152,250
Outstanding Balance
$64,829
Interest Rate
6.91%
Mortgage Type
FHA
Estimated Equity
$331,169
Purchase Details
Closed on
Sep 30, 1996
Sold by
Grotelueschen Seth J and Grotelueschen Laurie L
Bought by
Krefft David and Krefft Lisa M
Create a Home Valuation Report for This Property
The Home Valuation Report is an in-depth analysis detailing your home's value as well as a comparison with similar homes in the area
Home Values in the Area
Average Home Value in this Area
Purchase History
| Date | Buyer | Sale Price | Title Company |
|---|---|---|---|
| Rankins Jerry | $225,000 | -- | |
| Krefft David | $153,000 | -- |
Source: Public Records
Mortgage History
| Date | Status | Borrower | Loan Amount |
|---|---|---|---|
| Open | Rankins Jerry | $152,250 |
Source: Public Records
Tax History Compared to Growth
Tax History
| Year | Tax Paid | Tax Assessment Tax Assessment Total Assessment is a certain percentage of the fair market value that is determined by local assessors to be the total taxable value of land and additions on the property. | Land | Improvement |
|---|---|---|---|---|
| 2024 | $9,924 | $29,000 | $5,808 | $23,192 |
| 2023 | $8,872 | $29,000 | $5,808 | $23,192 |
| 2022 | $8,872 | $21,914 | $5,016 | $16,898 |
| 2021 | $10,505 | $21,914 | $5,016 | $16,898 |
| 2020 | $10,368 | $21,914 | $5,016 | $16,898 |
| 2019 | $10,648 | $20,283 | $4,488 | $15,795 |
| 2018 | $10,356 | $20,283 | $4,488 | $15,795 |
| 2017 | $10,043 | $20,283 | $4,488 | $15,795 |
| 2016 | $8,879 | $16,794 | $3,960 | $12,834 |
| 2015 | $8,203 | $16,794 | $3,960 | $12,834 |
| 2014 | $7,531 | $16,794 | $3,960 | $12,834 |
| 2013 | $7,385 | $17,897 | $3,960 | $13,937 |
Source: Public Records
Map
Nearby Homes