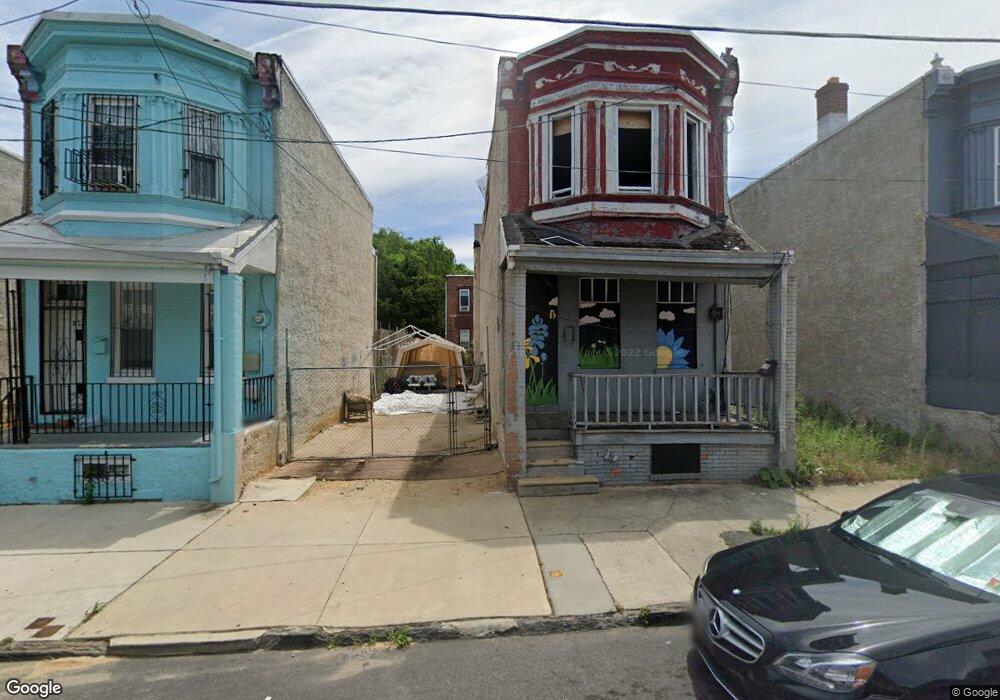
818 N 4th St Camden, NJ 08102
North Camden NeighborhoodEstimated Value: $99,144 - $191,000
--
Bed
--
Bath
1,273
Sq Ft
$114/Sq Ft
Est. Value
About This Home
This home is located at 818 N 4th St, Camden, NJ 08102 and is currently estimated at $144,786, approximately $113 per square foot. 818 N 4th St is a home located in Camden County with nearby schools including Cooper's Poynt Elementary School, Eastside High School, and Leap Academy University Charter School.
Ownership History
Date
Name
Owned For
Owner Type
Purchase Details
Closed on
Mar 29, 2023
Sold by
Genesis Home Builders And Remodelers Llc
Bought by
818 Llc
Current Estimated Value
Purchase Details
Closed on
Jan 25, 2023
Sold by
Trust Number 818
Bought by
Genesis Home Builders And Remodelers Llc
Purchase Details
Closed on
Aug 2, 2001
Sold by
Mcmenamin Thomas
Bought by
Velez Blanca I
Create a Home Valuation Report for This Property
The Home Valuation Report is an in-depth analysis detailing your home's value as well as a comparison with similar homes in the area
Home Values in the Area
Average Home Value in this Area
Purchase History
| Date | Buyer | Sale Price | Title Company |
|---|---|---|---|
| 818 Llc | $4,375 | None Listed On Document | |
| Genesis Home Builders And Remodelers Llc | -- | Surety Title | |
| Genesis Home Builders And Remodelers Llc | -- | Surety Title | |
| Velez Blanca I | $7,300 | -- |
Source: Public Records
Tax History Compared to Growth
Tax History
| Year | Tax Paid | Tax Assessment Tax Assessment Total Assessment is a certain percentage of the fair market value that is determined by local assessors to be the total taxable value of land and additions on the property. | Land | Improvement |
|---|---|---|---|---|
| 2025 | $953 | $26,900 | $6,300 | $20,600 |
| 2024 | $921 | $26,900 | $6,300 | $20,600 |
| 2023 | $921 | $26,900 | $6,300 | $20,600 |
| 2022 | $904 | $26,900 | $6,300 | $20,600 |
| 2021 | $901 | $26,900 | $6,300 | $20,600 |
| 2020 | $855 | $26,900 | $6,300 | $20,600 |
| 2019 | $819 | $26,900 | $6,300 | $20,600 |
| 2018 | $815 | $26,900 | $6,300 | $20,600 |
| 2017 | $795 | $26,900 | $6,300 | $20,600 |
| 2016 | $770 | $26,900 | $6,300 | $20,600 |
| 2015 | $741 | $26,900 | $6,300 | $20,600 |
| 2014 | $723 | $26,900 | $6,300 | $20,600 |
Source: Public Records
Map
Nearby Homes