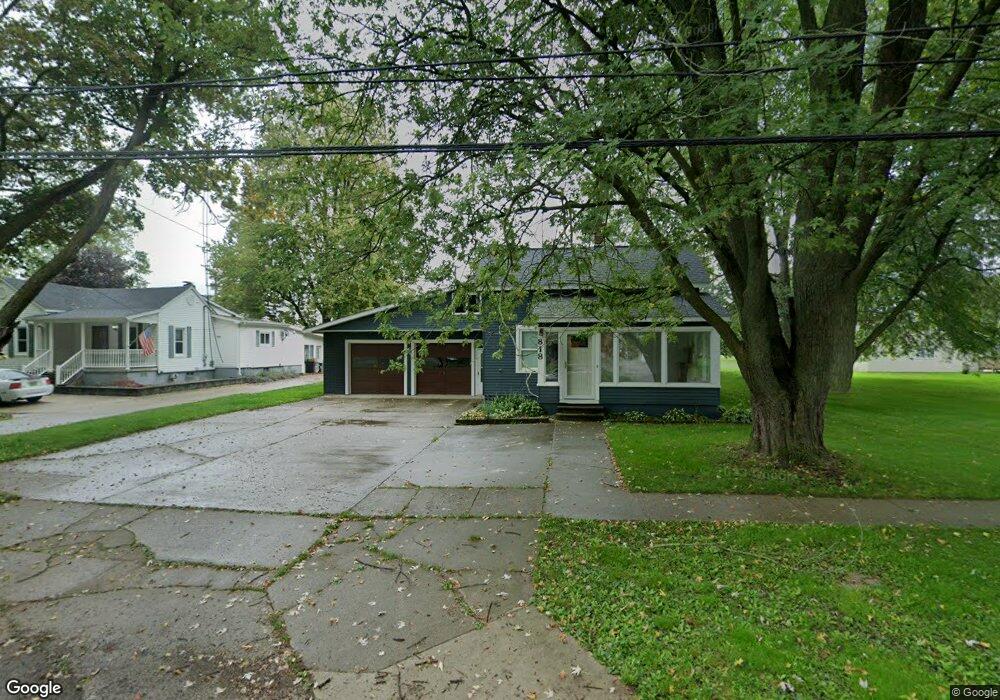
818 N Main St Almont, MI 48003
Estimated Value: $244,000 - $312,137
3
Beds
2
Baths
2,159
Sq Ft
$124/Sq Ft
Est. Value
About This Home
This home is located at 818 N Main St, Almont, MI 48003 and is currently estimated at $267,784, approximately $124 per square foot. 818 N Main St is a home located in Lapeer County with nearby schools including Almont Middle School, Orchard Primary School, and Almont High School.
Ownership History
Date
Name
Owned For
Owner Type
Purchase Details
Closed on
Aug 10, 2021
Sold by
Martelli Dean
Bought by
The Dean Martelli Revocable Living Trust
Current Estimated Value
Home Financials for this Owner
Home Financials are based on the most recent Mortgage that was taken out on this home.
Original Mortgage
$60,000
Outstanding Balance
$54,476
Interest Rate
2.8%
Mortgage Type
New Conventional
Estimated Equity
$213,308
Purchase Details
Closed on
Apr 25, 2018
Sold by
Martelli Dean
Bought by
Martelli Dean and Martelli Dean
Purchase Details
Closed on
Jan 26, 2011
Sold by
Fannie Mae
Bought by
Martelli Dean
Purchase Details
Closed on
Apr 5, 2010
Sold by
Financial Freedom Acquisitions Llc
Bought by
Federal National Mortgage Association
Purchase Details
Closed on
Mar 31, 2010
Sold by
Haddix Fred R and Haddix Beulah I
Bought by
Financial Freedom Acquisition Llc
Create a Home Valuation Report for This Property
The Home Valuation Report is an in-depth analysis detailing your home's value as well as a comparison with similar homes in the area
Home Values in the Area
Average Home Value in this Area
Purchase History
| Date | Buyer | Sale Price | Title Company |
|---|---|---|---|
| The Dean Martelli Revocable Living Trust | -- | Century Title Agency Svcs | |
| Martelli Dean | -- | Century Title Agency Svcs | |
| Martelli Dean | -- | -- | |
| Martelli Dean | $35,000 | -- | |
| Federal National Mortgage Association | -- | -- | |
| Financial Freedom Acquisition Llc | $126,801 | -- |
Source: Public Records
Mortgage History
| Date | Status | Borrower | Loan Amount |
|---|---|---|---|
| Open | Martelli Dean | $60,000 |
Source: Public Records
Tax History Compared to Growth
Tax History
| Year | Tax Paid | Tax Assessment Tax Assessment Total Assessment is a certain percentage of the fair market value that is determined by local assessors to be the total taxable value of land and additions on the property. | Land | Improvement |
|---|---|---|---|---|
| 2025 | $1,390 | $99,700 | $0 | $0 |
| 2024 | $1,718 | $91,600 | $0 | $0 |
| 2023 | $1,664 | $83,500 | $0 | $0 |
| 2022 | $2,679 | $76,600 | $0 | $0 |
| 2021 | $2,508 | $82,300 | $0 | $0 |
| 2020 | $2,481 | $79,700 | $0 | $0 |
| 2019 | $2,483 | $74,600 | $0 | $0 |
| 2018 | $2,428 | $68,500 | $68,500 | $0 |
| 2017 | $2,400 | $66,700 | $0 | $0 |
| 2016 | $1,447 | $63,900 | $63,900 | $0 |
| 2015 | -- | $0 | $0 | $0 |
| 2014 | -- | $53,400 | $53,400 | $0 |
| 2013 | -- | $49,000 | $49,000 | $0 |
Source: Public Records
Map
Nearby Homes
- 736 N Main St
- 0 Johnson St
- 4646 Howland Rd
- 708 Greenbriar Ln
- 239 Almont Ave
- 783 Ascot Cir
- 678 Ascot Cir
- 309 School St
- 0 Van Dyke Rd Unit 2210043490
- 4940 Daisy Ln
- 5636 Fir Ct
- 5630 Fir Ct
- 513 E Saint Clair St
- 318 Cherry St
- 334 W Winds Dr
- 5135 Cheryl Dr
- 5071 June Dr
- 5156 Elizabeth Ln
- 00 Hough
- 000 Hough