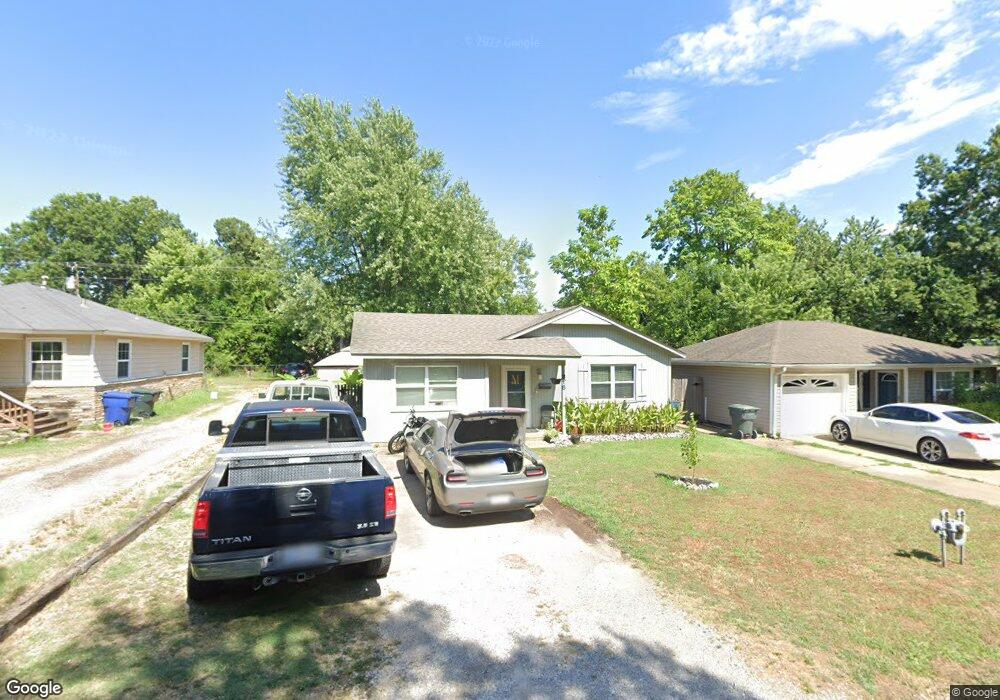
818 N Osage Ave Claremore, OK 74017
Estimated Value: $129,000 - $145,000
2
Beds
1
Bath
1,202
Sq Ft
$116/Sq Ft
Est. Value
About This Home
This home is located at 818 N Osage Ave, Claremore, OK 74017 and is currently estimated at $139,828, approximately $116 per square foot. 818 N Osage Ave is a home located in Rogers County with nearby schools including Claremont Elementary School, Will Rogers Junior High School, and Claremore High School.
Ownership History
Date
Name
Owned For
Owner Type
Purchase Details
Closed on
Jan 11, 2011
Sold by
Morris Michael L
Bought by
Morris Michael L and Morris Rachel N
Current Estimated Value
Purchase Details
Closed on
Aug 29, 2008
Sold by
Bassett William E
Bought by
Morris Michael L
Home Financials for this Owner
Home Financials are based on the most recent Mortgage that was taken out on this home.
Original Mortgage
$65,638
Interest Rate
6.54%
Mortgage Type
FHA
Purchase Details
Closed on
Jun 3, 2008
Sold by
Serino Durward and Serino Nellie A
Bought by
Bassett William E
Home Financials for this Owner
Home Financials are based on the most recent Mortgage that was taken out on this home.
Original Mortgage
$43,000
Interest Rate
6.08%
Mortgage Type
Unknown
Purchase Details
Closed on
Mar 20, 1997
Sold by
Wood Samuel H
Create a Home Valuation Report for This Property
The Home Valuation Report is an in-depth analysis detailing your home's value as well as a comparison with similar homes in the area
Home Values in the Area
Average Home Value in this Area
Purchase History
| Date | Buyer | Sale Price | Title Company |
|---|---|---|---|
| Morris Michael L | -- | None Available | |
| Morris Michael L | $66,500 | Land Title Closing Services | |
| Bassett William E | $41,500 | Land Title Closing Services | |
| -- | $47,500 | -- |
Source: Public Records
Mortgage History
| Date | Status | Borrower | Loan Amount |
|---|---|---|---|
| Open | Morris Michael L | $65,638 | |
| Previous Owner | Bassett William E | $43,000 |
Source: Public Records
Tax History Compared to Growth
Tax History
| Year | Tax Paid | Tax Assessment Tax Assessment Total Assessment is a certain percentage of the fair market value that is determined by local assessors to be the total taxable value of land and additions on the property. | Land | Improvement |
|---|---|---|---|---|
| 2024 | $656 | $8,094 | $1,378 | $6,716 |
| 2023 | $656 | $7,858 | $1,210 | $6,648 |
| 2022 | $647 | $7,993 | $1,210 | $6,783 |
| 2021 | $624 | $8,069 | $1,210 | $6,859 |
| 2020 | $631 | $7,939 | $1,210 | $6,729 |
| 2019 | $617 | $7,662 | $1,210 | $6,452 |
| 2018 | $645 | $7,979 | $1,210 | $6,769 |
| 2017 | $622 | $7,773 | $1,210 | $6,563 |
| 2016 | $615 | $7,547 | $1,210 | $6,337 |
| 2015 | $587 | $7,327 | $1,210 | $6,117 |
| 2014 | $496 | $6,352 | $1,210 | $5,142 |
Source: Public Records
Map
Nearby Homes
- 1012 N Osage Ave
- 810 E 9th St N
- 805 E 10th St
- 1119 N Oklahoma Ave
- 310 E 12th St
- 1114 N Kansas Ave
- 1206 N Sioux Ave
- 805 E Comet St
- 221 N Dorothy Ave
- 1027 N Miller Dr
- 0 Na NE Unit 1080799
- 998 N Douglas Dr
- 1335 N Mcfarland Place
- 428 E 4th St
- 617 N Chickasaw Ave
- 104 W 7th St
- 321 E 4th St
- 1200 N Faulkner Dr
- 317 E 4th St
- 609 N Weenonah Ave
- 810 N Osage Ave
- 820 N Osage Ave
- 808 N Osage Ave
- 701 E 11th St
- 809 N Osage Ave
- 706 E 10th St
- 819 N Sioux Ave
- 807 N Sioux Ave
- 815 N Osage Ave
- 700 E 10th St
- 813 N Sioux Ave
- 827 N Sioux Ave
- 625 E 11th St
- 608 E 10th St
- 900 N Osage Ave
- 606 E 10th St
- 803 N Sioux Ave
- 748 E 11th St
- 701 E 10th St
- 902 N Osage Ave