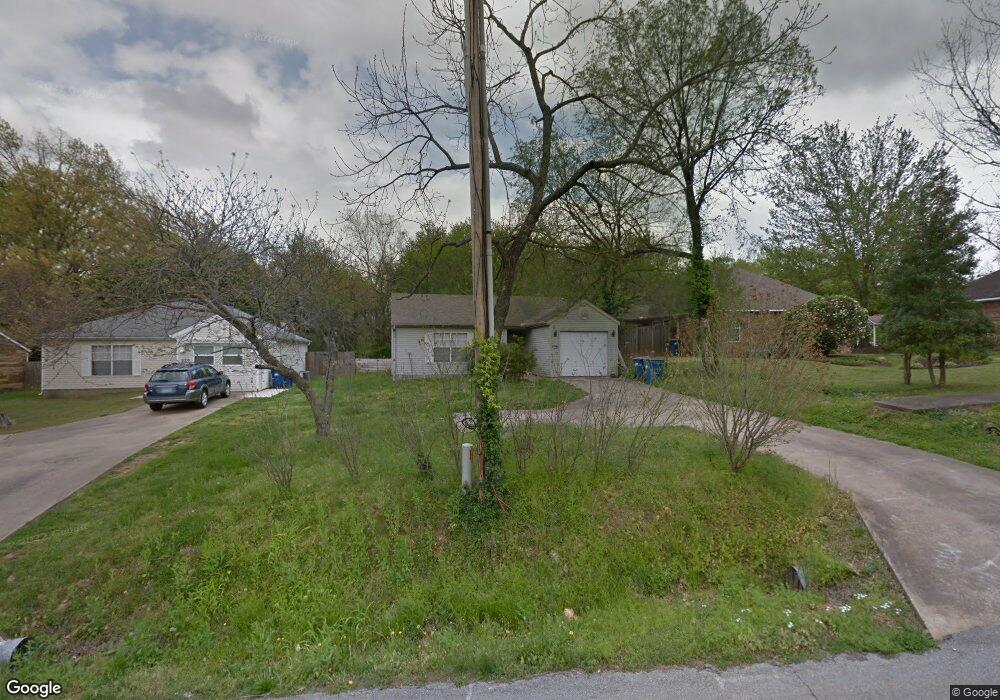
818 NE A St Bentonville, AR 72712
Estimated Value: $460,000 - $543,214
2
Beds
2
Baths
915
Sq Ft
$559/Sq Ft
Est. Value
About This Home
This home is located at 818 NE A St, Bentonville, AR 72712 and is currently estimated at $511,304, approximately $558 per square foot. 818 NE A St is a home located in Benton County with nearby schools including Sugar Creek Elementary School, Old High Middle School, and Lincoln Junior High School.
Ownership History
Date
Name
Owned For
Owner Type
Purchase Details
Closed on
Dec 7, 2023
Sold by
Norman William H
Bought by
William H Norman Trust and Norman
Current Estimated Value
Purchase Details
Closed on
Sep 11, 2017
Sold by
Conner Drew and Conner Alicia Marie
Bought by
Norman William Hamman and Roberson Millicent Elaine
Home Financials for this Owner
Home Financials are based on the most recent Mortgage that was taken out on this home.
Original Mortgage
$131,250
Interest Rate
3.92%
Mortgage Type
New Conventional
Purchase Details
Closed on
Aug 17, 2009
Sold by
Shive William L and Zhou Lijuan
Bought by
Conner Drew
Home Financials for this Owner
Home Financials are based on the most recent Mortgage that was taken out on this home.
Original Mortgage
$74,700
Interest Rate
5.16%
Purchase Details
Closed on
Sep 1, 1999
Bought by
Shive
Purchase Details
Closed on
Aug 3, 1998
Bought by
Le
Create a Home Valuation Report for This Property
The Home Valuation Report is an in-depth analysis detailing your home's value as well as a comparison with similar homes in the area
Home Values in the Area
Average Home Value in this Area
Purchase History
| Date | Buyer | Sale Price | Title Company |
|---|---|---|---|
| William H Norman Trust | -- | None Listed On Document | |
| Norman William Hamman | $190,000 | Pci Advance Title Llc | |
| Conner Drew | $79,000 | None Available | |
| Shive | $63,000 | -- | |
| Le | $58,000 | -- |
Source: Public Records
Mortgage History
| Date | Status | Borrower | Loan Amount |
|---|---|---|---|
| Previous Owner | Norman William Hamman | $131,250 | |
| Previous Owner | Conner Drew | $74,700 |
Source: Public Records
Tax History Compared to Growth
Tax History
| Year | Tax Paid | Tax Assessment Tax Assessment Total Assessment is a certain percentage of the fair market value that is determined by local assessors to be the total taxable value of land and additions on the property. | Land | Improvement |
|---|---|---|---|---|
| 2025 | $1,734 | $108,838 | $66,592 | $42,246 |
| 2024 | $1,597 | $108,838 | $66,592 | $42,246 |
| 2023 | $1,452 | $71,560 | $60,630 | $10,930 |
| 2022 | $1,372 | $71,560 | $60,630 | $10,930 |
| 2021 | $1,254 | $71,560 | $60,630 | $10,930 |
| 2020 | $1,150 | $18,060 | $3,800 | $14,260 |
| 2019 | $1,150 | $18,060 | $3,800 | $14,260 |
| 2018 | $1,150 | $18,060 | $3,800 | $14,260 |
| 2017 | $514 | $18,060 | $3,800 | $14,260 |
| 2016 | $514 | $18,060 | $3,800 | $14,260 |
| 2015 | $824 | $13,340 | $4,000 | $9,340 |
| 2014 | $474 | $13,340 | $4,000 | $9,340 |
Source: Public Records
Map
Nearby Homes
- 803 NE A St
- 905 N Main St
- 910 NW A St Unit 1&2
- 118 NE Briartown Mews
- 1104 Fillmore St
- 813 NW A St
- 204 NW 9th St
- 0 Briartown Mews
- 208 NW 9th St
- 1109 NE Monroe
- 216 NW 9th St
- 218 NW 9th St
- 1019 N Main St
- 1143 NE Monroe St
- 1145 NE Monroe St
- 1039 NW A St
- 706 NW B St
- 204 NE Lake St
- Lot 28 Lake St
- 501 N Main St
- 820 NE A St
- 822 NE A St
- 824 NE A St
- 821 NE A St
- 5 Fillmore St
- 823 NE A St
- 819 NE A St
- 817 NE A St
- 825 NE A St
- 302 NE Black Apple Ln
- 300 NE Black Apple Ln
- 304 NE Black Apple Ln
- 906 NE A St
- 306 NE Black Apple Ln
- 815 NE A St
- 904 NE A St
- 322 NE Black Apple Ln Unit A
- 322 NE Black Apple Ln
- 308 NE Black Apple Ln
- 813 NE A St