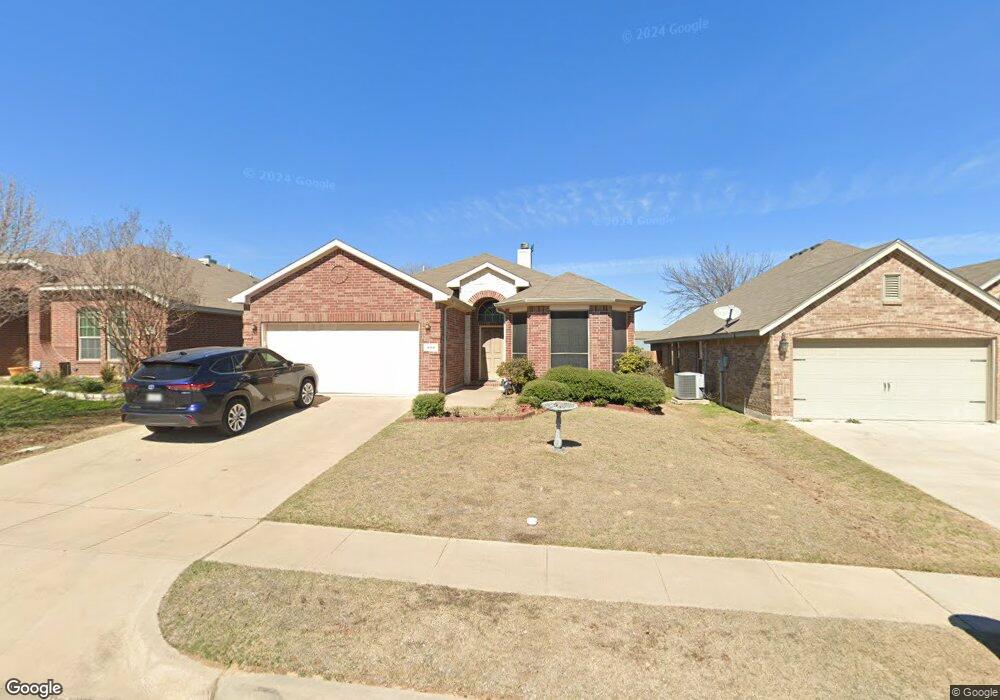
818 Randall Rd Weatherford, TX 76087
Estimated Value: $312,650 - $334,000
3
Beds
2
Baths
1,624
Sq Ft
$197/Sq Ft
Est. Value
About This Home
This home is located at 818 Randall Rd, Weatherford, TX 76087 and is currently estimated at $319,163, approximately $196 per square foot. 818 Randall Rd is a home located in Parker County with nearby schools including Curtis Elementary School, Hall Middle School, and Weatherford High School.
Ownership History
Date
Name
Owned For
Owner Type
Purchase Details
Closed on
Dec 31, 2018
Sold by
Perrow Robert Wayne
Bought by
Perrow Patricia C
Current Estimated Value
Purchase Details
Closed on
Jun 1, 2016
Sold by
Orellana Selena
Bought by
Perrow Robert Wayne and Perrow Patricia Cook
Purchase Details
Closed on
Sep 21, 2011
Sold by
D R Horton - Texas Ltd
Bought by
Perrow Robert Wayne and Patricia Cook
Home Financials for this Owner
Home Financials are based on the most recent Mortgage that was taken out on this home.
Original Mortgage
$144,158
Interest Rate
4.25%
Mortgage Type
FHA
Purchase Details
Closed on
Jun 23, 2011
Sold by
Smrp Real Estate Ltd
Bought by
Perrow Robert Wayne and Patricia Cook
Create a Home Valuation Report for This Property
The Home Valuation Report is an in-depth analysis detailing your home's value as well as a comparison with similar homes in the area
Home Values in the Area
Average Home Value in this Area
Purchase History
| Date | Buyer | Sale Price | Title Company |
|---|---|---|---|
| Perrow Patricia C | -- | None Available | |
| Cook Patricia Blanche | -- | None Available | |
| Perrow Robert Wayne | -- | Providence Title Company | |
| Perrow Robert Wayne | -- | -- | |
| Orellana Selena | -- | None Available | |
| Perrow Robert Wayne | -- | -- |
Source: Public Records
Mortgage History
| Date | Status | Borrower | Loan Amount |
|---|---|---|---|
| Previous Owner | Perrow Robert Wayne | $144,158 | |
| Closed | Orellana Selena | $0 |
Source: Public Records
Tax History Compared to Growth
Tax History
| Year | Tax Paid | Tax Assessment Tax Assessment Total Assessment is a certain percentage of the fair market value that is determined by local assessors to be the total taxable value of land and additions on the property. | Land | Improvement |
|---|---|---|---|---|
| 2025 | $2,375 | $260,465 | -- | -- |
| 2024 | $2,375 | $236,786 | -- | -- |
| 2023 | $2,375 | $215,260 | $0 | $0 |
| 2022 | $4,341 | $210,720 | $25,000 | $185,720 |
| 2021 | $4,272 | $210,720 | $25,000 | $185,720 |
| 2020 | $3,908 | $161,730 | $25,000 | $136,730 |
| 2019 | $4,130 | $161,730 | $25,000 | $136,730 |
| 2018 | $4,389 | $171,100 | $25,000 | $146,100 |
| 2017 | $4,502 | $171,100 | $25,000 | $146,100 |
| 2016 | $3,976 | $151,110 | $25,000 | $126,110 |
| 2015 | $3,515 | $151,110 | $25,000 | $126,110 |
| 2014 | $3,232 | $137,050 | $25,000 | $112,050 |
Source: Public Records
Map
Nearby Homes
- 842 Randall Rd
- 914 Randall Rd
- 2209 Caroline Dr
- 825 Jodie Dr
- 909 Jodie Dr
- 2533 Hadley St
- 2532 Hadley St
- 1220 Scott Dr
- 1036 Deer Valley Dr
- 1015 W Park Ave Unit D
- 1015 W Park Ave Unit LOT A
- 1015 W Park Ave Unit LOT B
- 3770 Bethel Rd
- 1921 Bay Laurel Dr
- 2361 Waggoner Ranch Dr
- 2381 Waggoner Ranch Dr
- 2416 Waggoner Ranch Dr
- 2344 Briscoe Ranch Dr
- 741 Nandina Rd
- 1252 Kerrville Ln
- 814 Randall Rd
- 822 Randall Rd
- 810 Randall Rd
- 826 Randall Rd
- 2202 Brandy Dr
- 2201 Whitney Dr
- 830 Randall Rd
- 806 Randall Rd
- 834 Randall Rd
- 2206 Brandy Dr
- 2205 Whitney Dr
- 802 Randall Rd
- 838 Randall Rd
- 2210 Brandy Dr
- 2209 Whitney Dr
- 2201 Brandy Dr
- 2202 Whitney Dr
- 2205 Brandy Dr
- 2206 Whitney Dr
- 842 Randall Ridge