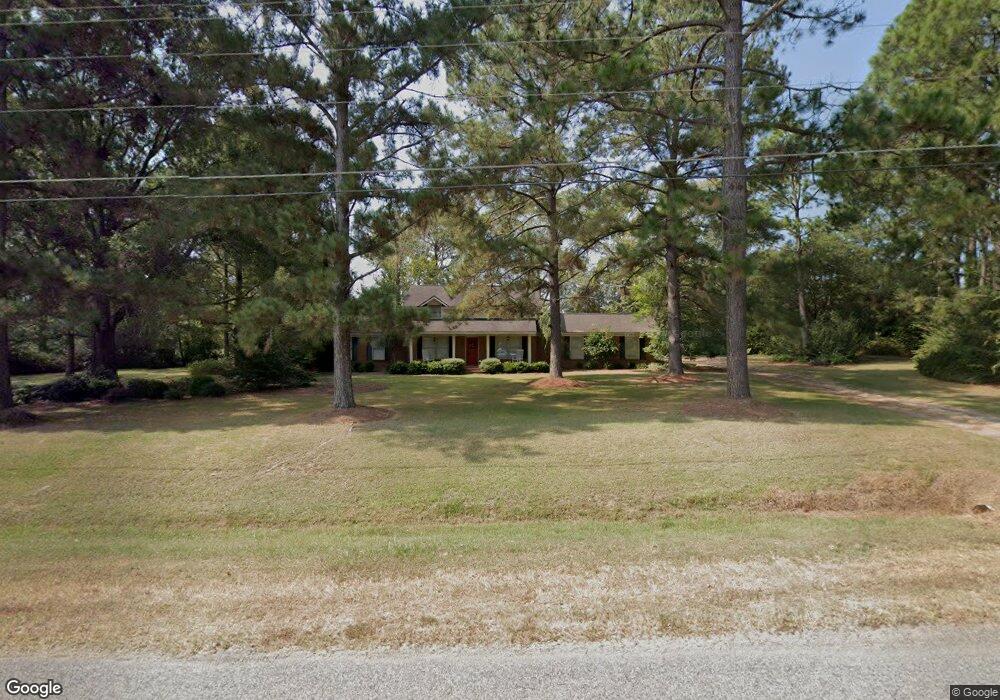
818 Rutland Rd Tifton, GA 31793
Estimated Value: $241,253 - $312,000
3
Beds
2
Baths
2,290
Sq Ft
$125/Sq Ft
Est. Value
About This Home
This home is located at 818 Rutland Rd, Tifton, GA 31793 and is currently estimated at $285,563, approximately $124 per square foot. 818 Rutland Rd is a home located in Tift County with nearby schools including Annie Belle Clark Primary School, Matt Wilson Elementary School, and J.T. Reddick School.
Ownership History
Date
Name
Owned For
Owner Type
Purchase Details
Closed on
Aug 20, 2019
Sold by
Banks Ben T
Bought by
Searcy Jonathon Van Keith
Current Estimated Value
Home Financials for this Owner
Home Financials are based on the most recent Mortgage that was taken out on this home.
Original Mortgage
$128,557
Outstanding Balance
$5,665
Interest Rate
3.7%
Mortgage Type
New Conventional
Estimated Equity
$279,898
Purchase Details
Closed on
May 20, 2015
Sold by
Willis Linda D
Bought by
Banks Ben T
Purchase Details
Closed on
Jan 16, 2008
Sold by
Willis Forrest Dale
Bought by
Willis Linda D
Purchase Details
Closed on
Dec 30, 2003
Sold by
Horner Frankie Ester R
Bought by
Willis Forrest Dale and Willis Linda D
Purchase Details
Closed on
Jul 22, 1993
Bought by
Willis Forrest Dale
Purchase Details
Closed on
Apr 26, 1993
Bought by
Horner Frankie Esther R
Purchase Details
Closed on
Jan 25, 1985
Bought by
Rutland E O
Create a Home Valuation Report for This Property
The Home Valuation Report is an in-depth analysis detailing your home's value as well as a comparison with similar homes in the area
Home Values in the Area
Average Home Value in this Area
Purchase History
| Date | Buyer | Sale Price | Title Company |
|---|---|---|---|
| Searcy Jonathon Van Keith | $143,000 | -- | |
| Banks Ben T | -- | -- | |
| Willis Linda D | -- | -- | |
| Willis Forrest Dale | -- | -- | |
| Willis Forrest Dale | $72,500 | -- | |
| Horner Frankie Esther R | -- | -- | |
| Rutland E O | $78,500 | -- |
Source: Public Records
Mortgage History
| Date | Status | Borrower | Loan Amount |
|---|---|---|---|
| Open | Searcy Jonathon Van Keith | $128,557 |
Source: Public Records
Tax History Compared to Growth
Tax History
| Year | Tax Paid | Tax Assessment Tax Assessment Total Assessment is a certain percentage of the fair market value that is determined by local assessors to be the total taxable value of land and additions on the property. | Land | Improvement |
|---|---|---|---|---|
| 2024 | $1,730 | $81,278 | $2,736 | $78,542 |
| 2023 | $1,879 | $52,594 | $1,890 | $50,704 |
| 2022 | $1,502 | $52,594 | $1,890 | $50,704 |
| 2021 | $1,511 | $52,594 | $1,890 | $50,704 |
| 2020 | $1,600 | $52,594 | $1,890 | $50,704 |
| 2019 | $1,597 | $52,594 | $1,890 | $50,704 |
| 2018 | $1,595 | $52,594 | $1,890 | $50,704 |
| 2017 | $1,602 | $52,594 | $1,890 | $50,704 |
| 2016 | $1,604 | $52,594 | $1,890 | $50,704 |
| 2015 | $1,541 | $52,594 | $1,890 | $50,704 |
| 2014 | $1,541 | $52,594 | $1,890 | $50,704 |
| 2013 | -- | $52,594 | $1,890 | $50,704 |
Source: Public Records
Map
Nearby Homes
- 100 Elizabeth Dr
- 1808 Rutland Rd
- 2008 Rutland Rd Unit 10
- 2008 Rutland Rd
- Tract 1 Whiddon Mill Rd
- 21 Willow Way
- 131 Oak Point Ave
- 106 Mill Ridge Cir
- 26 Alan Ln
- 1901 Melba Dr
- 31 Henry Way
- 7 Deborah Dr
- 0 W Hutchinson Rd
- 9 Country Club Place
- 51 Logan Dr
- 1610 Mallard Ln
- 1607 Mallard Ln
- W Hutchinson Rd
- 0 S Carpenter Rd
- 11 Fairway Dr
- 1003 Rutland Rd
- 1006 Rutland Rd
- 821 Rutland Rd
- 1001 Rutland Rd
- 1021 Rutland Rd
- 1005 Rutland Rd
- 817 Rutland Rd
- 814 Rutland Rd
- 1007 Rutland Rd
- 811 Rutland Rd
- 810 Rutland Rd
- 1015 Rutland Rd
- 806 Rutland Rd
- 802 Rutland Rd
- 1025 Rutland Rd
- 0 Rutland Rd
- land Rutland Rd
- 608 Rutland Rd
- 606 Rutland Rd
- 1399 Rutland Rd Unit TRACT 1