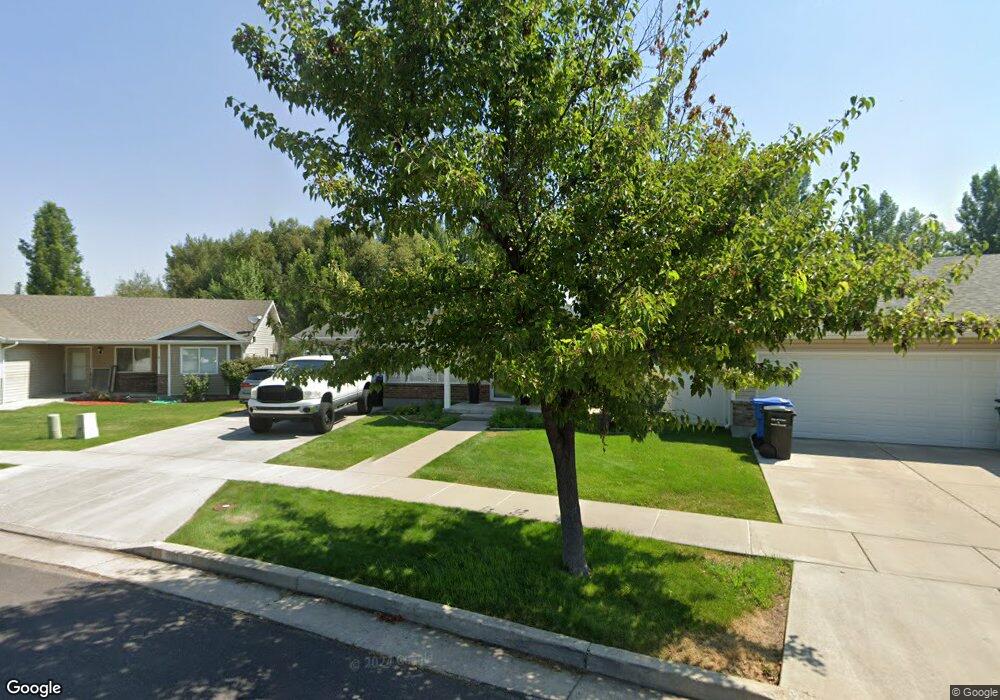
818 S 670 W Logan, UT 84321
Woodruff NeighborhoodEstimated Value: $357,000 - $422,000
3
Beds
2
Baths
1,064
Sq Ft
$360/Sq Ft
Est. Value
About This Home
This home is located at 818 S 670 W, Logan, UT 84321 and is currently estimated at $383,334, approximately $360 per square foot. 818 S 670 W is a home located in Cache County with nearby schools including Woodruff School, Mount Logan Middle School, and Logan High School.
Ownership History
Date
Name
Owned For
Owner Type
Purchase Details
Closed on
May 21, 2021
Sold by
Tanner Chelsee M and Tanner Mitchell A
Bought by
Good John
Current Estimated Value
Home Financials for this Owner
Home Financials are based on the most recent Mortgage that was taken out on this home.
Original Mortgage
$304,385
Outstanding Balance
$275,262
Interest Rate
3.1%
Mortgage Type
FHA
Estimated Equity
$108,072
Purchase Details
Closed on
Jun 2, 2017
Sold by
Griffin Tad Allen and Griffin Tyler Jay
Bought by
Tanner Chelsee M and Tanner Mitchell A
Home Financials for this Owner
Home Financials are based on the most recent Mortgage that was taken out on this home.
Original Mortgage
$161,020
Interest Rate
4.02%
Mortgage Type
New Conventional
Purchase Details
Closed on
May 18, 2011
Sold by
Rollins Calvin and Rollins Elinor
Bought by
Griffin Dennis I and Griffin Grace H
Purchase Details
Closed on
Sep 26, 2006
Sold by
Horizons Construction & Developments Inc
Bought by
Rollins Calvin and Rollins Elinor
Create a Home Valuation Report for This Property
The Home Valuation Report is an in-depth analysis detailing your home's value as well as a comparison with similar homes in the area
Home Values in the Area
Average Home Value in this Area
Purchase History
| Date | Buyer | Sale Price | Title Company |
|---|---|---|---|
| Good John | -- | American Secure Title Logan | |
| Tanner Chelsee M | -- | American Secure Title | |
| Griffin Dennis I | -- | American Secure Title Logan | |
| Rollins Calvin | -- | American Secure Title | |
| Horizons Construction & Developments Llc | -- | American Secure Title |
Source: Public Records
Mortgage History
| Date | Status | Borrower | Loan Amount |
|---|---|---|---|
| Open | Good John | $304,385 | |
| Closed | Good John | $17,500 | |
| Previous Owner | Tanner Chelsee M | $161,020 |
Source: Public Records
Tax History
| Year | Tax Paid | Tax Assessment Tax Assessment Total Assessment is a certain percentage of the fair market value that is determined by local assessors to be the total taxable value of land and additions on the property. | Land | Improvement |
|---|---|---|---|---|
| 2025 | $1,630 | $210,755 | $0 | $0 |
| 2024 | $1,672 | $209,465 | $0 | $0 |
| 2023 | $1,727 | $206,195 | $0 | $0 |
| 2022 | $1,553 | $173,195 | $0 | $0 |
| 2021 | $1,215 | $209,320 | $40,000 | $169,320 |
| 2020 | $1,208 | $187,235 | $40,000 | $147,235 |
| 2019 | $1,262 | $187,235 | $40,000 | $147,235 |
| 2018 | $1,266 | $171,460 | $40,000 | $131,460 |
| 2017 | $1,192 | $85,360 | $0 | $0 |
| 2016 | $1,236 | $71,875 | $0 | $0 |
| 2015 | $1,042 | $71,875 | $0 | $0 |
| 2014 | $942 | $71,875 | $0 | $0 |
| 2013 | -- | $71,875 | $0 | $0 |
Source: Public Records
Map
Nearby Homes
- 673 W 760 S
- 866 Riverwood Dr
- 658 W 500 S
- 553 Center Ave
- 839 S 300 W
- 501 Southwest St
- 1206 S 900 W
- 268 W 1030 S
- 233 W 1010 S
- 238 W 1010 S Unit 43
- 3048 S 400 W
- 1033 W 500 S
- 952 W 330 S
- 1400 S 940 W
- 1099 Three Pointe Ave
- 1214 W 575 S
- 563 S 1215 W Unit 133
- 551 S 1215 W Unit 131
- 551 S 1215 W
- 1031 W 350 S