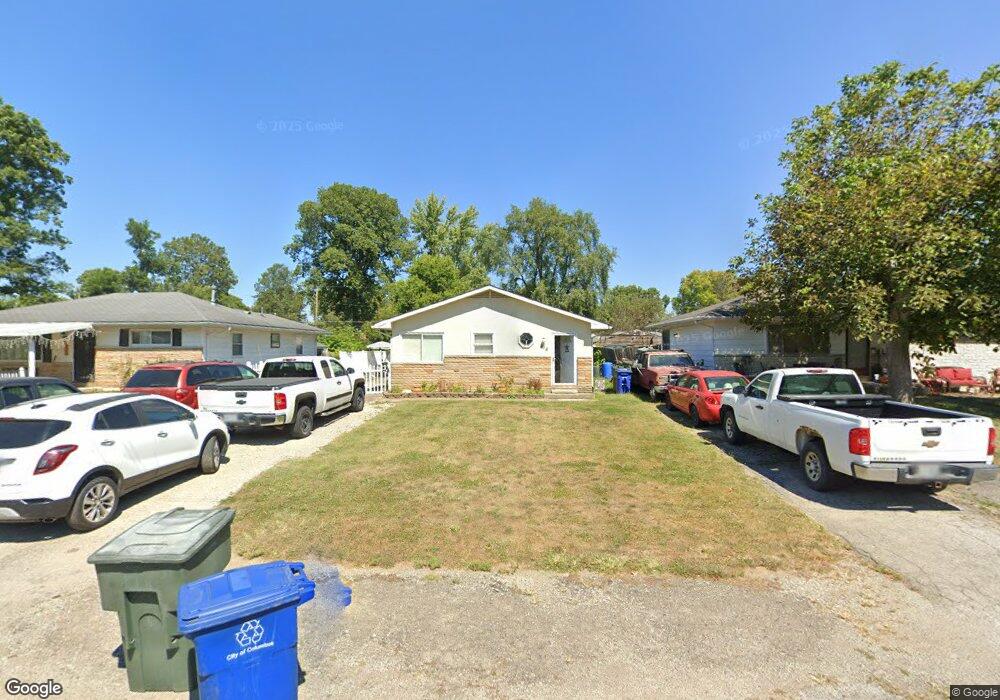
818 Stockbridge Rd Columbus, OH 43207
Obetz-Lockbourne NeighborhoodEstimated Value: $140,000 - $194,000
4
Beds
2
Baths
936
Sq Ft
$180/Sq Ft
Est. Value
About This Home
This home is located at 818 Stockbridge Rd, Columbus, OH 43207 and is currently estimated at $168,709, approximately $180 per square foot. 818 Stockbridge Rd is a home located in Franklin County with nearby schools including Parsons Elementary School, Buckeye Middle School, and Marion-Franklin High School.
Ownership History
Date
Name
Owned For
Owner Type
Purchase Details
Closed on
Aug 1, 2015
Sold by
Miller Kevin Scott
Bought by
Parsley Pauletta R
Current Estimated Value
Purchase Details
Closed on
Aug 30, 2010
Sold by
Parsley Birdie
Bought by
Miller Kevin Scott
Purchase Details
Closed on
Feb 10, 2009
Sold by
Wells Fargo Bank National Association
Bought by
Parsley Birdie
Purchase Details
Closed on
Jan 27, 2009
Sold by
Justice Randy and Case #07Cve11 16204
Bought by
Wells Fargo Bank National Association and Saxon Mortgage Services Inc
Purchase Details
Closed on
Jan 4, 1996
Sold by
Curry Mary E
Bought by
Ope Inc
Create a Home Valuation Report for This Property
The Home Valuation Report is an in-depth analysis detailing your home's value as well as a comparison with similar homes in the area
Home Values in the Area
Average Home Value in this Area
Purchase History
| Date | Buyer | Sale Price | Title Company |
|---|---|---|---|
| Parsley Pauletta R | $47,400 | Attorney | |
| Miller Kevin Scott | $53,000 | None Available | |
| Parsley Birdie | $53,000 | Attorney | |
| Wells Fargo Bank National Association | $50,000 | None Available | |
| Ope Inc | $40,000 | -- |
Source: Public Records
Tax History
| Year | Tax Paid | Tax Assessment Tax Assessment Total Assessment is a certain percentage of the fair market value that is determined by local assessors to be the total taxable value of land and additions on the property. | Land | Improvement |
|---|---|---|---|---|
| 2025 | $2,058 | $55,660 | $17,610 | $38,050 |
| 2024 | $2,058 | $55,660 | $17,610 | $38,050 |
| 2023 | $2,060 | $55,650 | $17,605 | $38,045 |
| 2022 | $997 | $27,970 | $9,420 | $18,550 |
| 2021 | $999 | $27,970 | $9,420 | $18,550 |
| 2020 | $1,000 | $27,970 | $9,420 | $18,550 |
| 2019 | $922 | $23,940 | $8,190 | $15,750 |
| 2018 | $959 | $23,940 | $8,190 | $15,750 |
| 2017 | $720 | $23,940 | $8,190 | $15,750 |
| 2016 | $519 | $16,590 | $3,850 | $12,740 |
| 2015 | $998 | $16,590 | $3,850 | $12,740 |
| 2014 | $1,000 | $16,590 | $3,850 | $12,740 |
| 2013 | $519 | $17,465 | $4,060 | $13,405 |
Source: Public Records
Map
Nearby Homes
- 780 Basswood Rd
- 860 Basswood Rd
- 3302 Hilock Place
- 3251 Hilock Ct
- 884 Bruckner Rd
- 691 Colton Rd
- 0 Williams Rd
- 1127 Rumsey Rd
- 1138 Hilock Rd Unit 35
- 1633-1635 E Greenway Ave
- 3608 S Champion Ave
- 3531 Lockbourne Rd
- 1118 Maplewood Rd
- 435 Carolann Ave
- 460 Coulter Ave
- 3380 Parsons Ave
- 562 Ashwood Rd
- 525 Ashwood Rd
- 577 Barcher Rd
- 228 Currier Dr
- 830 Stockbridge Rd
- 810 Stockbridge Rd
- 838 Stockbridge Rd
- 798 Stockbridge Rd
- 790 Stockbridge Rd
- 850 Stockbridge Rd
- 809 Basswood Rd
- 819 Basswood Rd
- 799 Basswood Rd
- 858 Stockbridge Rd
- 778 Stockbridge Rd
- 829 Basswood Rd
- 789 Basswood Rd
- 817 Stockbridge Rd
- 839 Basswood Rd
- 779 Basswood Rd
- 825 Stockbridge Rd
- 805 Stockbridge Rd
- 797 Stockbridge Rd
- 837 Stockbridge Rd
Your Personal Tour Guide
Ask me questions while you tour the home.