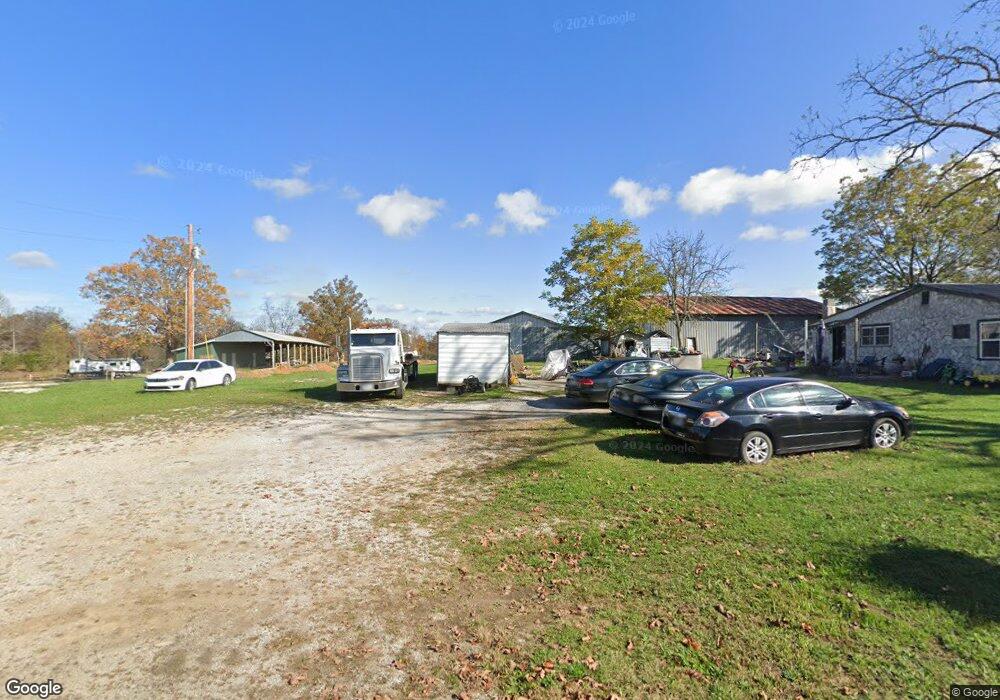
818 Trussell Rd Monteagle, TN 37356
Estimated Value: $188,000 - $356,000
Studio
1
Bath
1,200
Sq Ft
$229/Sq Ft
Est. Value
About This Home
This home is located at 818 Trussell Rd, Monteagle, TN 37356 and is currently estimated at $274,541, approximately $228 per square foot. 818 Trussell Rd is a home located in Marion County with nearby schools including Monteagle Elementary School, South Pittsburg Elementary School, and Jasper Elementary School.
Ownership History
Date
Name
Owned For
Owner Type
Purchase Details
Closed on
Jun 29, 2021
Sold by
Layne Benny Ray
Bought by
Kilgore Rodney L
Current Estimated Value
Home Financials for this Owner
Home Financials are based on the most recent Mortgage that was taken out on this home.
Original Mortgage
$239,500
Outstanding Balance
$215,415
Interest Rate
2.9%
Mortgage Type
Purchase Money Mortgage
Estimated Equity
$59,126
Purchase Details
Closed on
Apr 18, 2016
Sold by
Alternative Energy Partners Llc
Bought by
Layne Benny Ray
Purchase Details
Closed on
Oct 22, 2014
Sold by
Newsome Bufford
Bought by
Alternative Energy Partners Ll
Purchase Details
Closed on
Jul 22, 2008
Sold by
Thomas Charles E
Bought by
Buford Newsome
Purchase Details
Closed on
Jul 21, 2008
Sold by
Taylor Stevens Henry
Bought by
Thomas Charles E
Purchase Details
Closed on
May 28, 2008
Sold by
Taylor Stevens Henry
Bought by
Thomas Charles E
Purchase Details
Closed on
Nov 5, 2004
Sold by
Peck John M
Bought by
Thomas Charles E
Purchase Details
Closed on
Sep 16, 2004
Sold by
Stevens Henry T
Bought by
Peck John M
Purchase Details
Closed on
Mar 21, 1984
Bought by
Stevens Henry T and Stevens Georgia
Purchase Details
Closed on
Jan 2, 1900
Create a Home Valuation Report for This Property
The Home Valuation Report is an in-depth analysis detailing your home's value as well as a comparison with similar homes in the area
Home Values in the Area
Average Home Value in this Area
Purchase History
| Date | Buyer | Sale Price | Title Company |
|---|---|---|---|
| Kilgore Rodney L | $145,000 | None Available | |
| Layne Benny Ray | $60,000 | -- | |
| Alternative Energy Partners Ll | $60,000 | -- | |
| Buford Newsome | $55,000 | -- | |
| Thomas Charles E | -- | -- | |
| Thomas Charles E | $2,000 | -- | |
| Thomas Charles E | $67,100 | -- | |
| Peck John M | $44,172 | -- | |
| Stevens Henry T | -- | -- | |
| -- | -- | -- |
Source: Public Records
Mortgage History
| Date | Status | Borrower | Loan Amount |
|---|---|---|---|
| Open | Kilgore Rodney L | $239,500 |
Source: Public Records
Tax History
| Year | Tax Paid | Tax Assessment Tax Assessment Total Assessment is a certain percentage of the fair market value that is determined by local assessors to be the total taxable value of land and additions on the property. | Land | Improvement |
|---|---|---|---|---|
| 2025 | $185 | $45,220 | $19,975 | $25,245 |
| 2024 | $547 | $41,620 | $19,975 | $21,645 |
| 2023 | $547 | $31,100 | $0 | $0 |
| 2022 | $547 | $31,100 | $19,975 | $11,125 |
| 2021 | $547 | $31,100 | $19,975 | $11,125 |
| 2020 | $429 | $26,325 | $19,975 | $6,350 |
| 2019 | $429 | $19,800 | $15,400 | $4,400 |
| 2018 | $429 | $19,800 | $15,400 | $4,400 |
| 2017 | $577 | $26,625 | $15,400 | $11,225 |
| 2016 | $577 | $26,625 | $0 | $0 |
| 2015 | $593 | $26,625 | $0 | $0 |
| 2014 | $593 | $27,357 | $0 | $0 |
Source: Public Records
Map
Nearby Homes
- 227 Blackberry Farm Rd
- 221 Blackberry Farm Rd
- 206 Blackberry Farm Rd
- 205 Blackberry Farm Rd
- 214 Blackberry Farm Rd
- 201 Blackberry Farm Rd
- 520 Lautzenheiser Place
- 251 Wells St
- 31 Chickory Ln
- 408 Spring St
- 23 Laurel Lake Dr
- 21 Laurel Lake Dr
- 51 Mossy Rock Ln
- 210 Mountain Laurel Ln
- 42 Chickory Ln Unit 1
- 0 Laurel Lake Dr Unit 1513629
- 0 Laurel Lake Dr Unit 1513636
- 0 Laurel Lake Dr Unit 1513632
- 0 Laurel Lake Dr Unit RTC2891059
- 0 Laurel Lake Dr Unit 1513634
- 902 Trussell Rd
- 907 Trussell Rd
- 0 Wells St
- 0 Bell Rd
- 0 Jernigan Rd
- 1130 Jernigan Rd
- 707 Wells St
- 36 Westlake
- 35 Azalea Ridge Rd
- 37 Mtn Shadows Dr
- 0 Bostic Ave Unit 1677129
- 33 Westlake Ave
- 0 Bostic Ave Unit RTC2720529
- 0 Highlander Dr Unit RTC1807661
- 0 Highlander Dr Unit RTC1669734
- 0 Bostic Ave Unit RTC2524952
- 0 Bostic Ave Unit 1340922
- 1151 Jernigan Rd
- 1161 Bluebird Ln
- 1203 Jernigan Rd
Your Personal Tour Guide
Ask me questions while you tour the home.