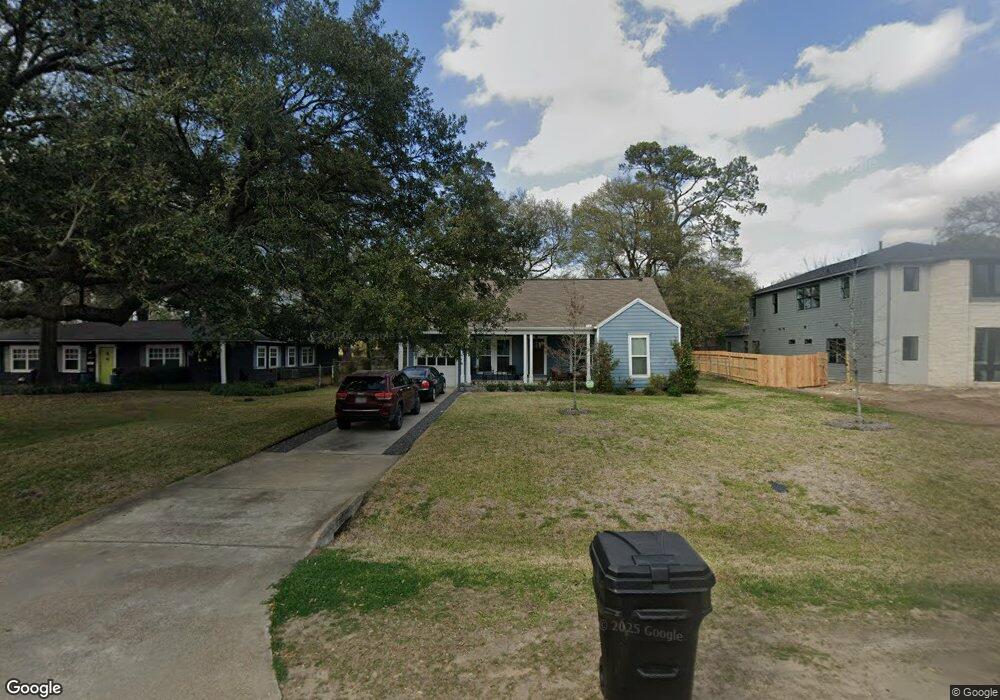
818 W 31st St Houston, TX 77018
Oak Forest-Garden Oaks NeighborhoodEstimated Value: $417,000 - $718,000
2
Beds
1
Bath
1,074
Sq Ft
$511/Sq Ft
Est. Value
About This Home
This home is located at 818 W 31st St, Houston, TX 77018 and is currently estimated at $548,417, approximately $510 per square foot. 818 W 31st St is a home located in Harris County with nearby schools including Garden Oaks Montessori, Frank Black Middle School, and Waltrip High School.
Ownership History
Date
Name
Owned For
Owner Type
Purchase Details
Closed on
Mar 11, 2016
Sold by
Foy Michael S
Bought by
Foy Michael S
Current Estimated Value
Home Financials for this Owner
Home Financials are based on the most recent Mortgage that was taken out on this home.
Original Mortgage
$145,900
Outstanding Balance
$62,928
Interest Rate
3.65%
Mortgage Type
New Conventional
Estimated Equity
$485,489
Purchase Details
Closed on
Sep 11, 2006
Sold by
Paravicini Nathalie Anne Veronique
Bought by
Foy Michael S
Home Financials for this Owner
Home Financials are based on the most recent Mortgage that was taken out on this home.
Original Mortgage
$27,450
Interest Rate
6.55%
Mortgage Type
Stand Alone Second
Purchase Details
Closed on
Nov 20, 2003
Sold by
Cobb David Keith and Cobb David
Bought by
Paravicini Nathalie Anne Veronique
Purchase Details
Closed on
May 19, 2003
Sold by
Cobb David Keith
Bought by
Paravicini Nathalie Anne Veronique
Create a Home Valuation Report for This Property
The Home Valuation Report is an in-depth analysis detailing your home's value as well as a comparison with similar homes in the area
Home Values in the Area
Average Home Value in this Area
Purchase History
| Date | Buyer | Sale Price | Title Company |
|---|---|---|---|
| Foy Michael S | -- | None Available | |
| Foy Michael S | -- | American Title Co | |
| Paravicini Nathalie Anne Veronique | -- | -- | |
| Paravicini Nathalie Anne Veronique | -- | -- |
Source: Public Records
Mortgage History
| Date | Status | Borrower | Loan Amount |
|---|---|---|---|
| Open | Foy Michael S | $145,900 | |
| Previous Owner | Foy Michael S | $27,450 | |
| Previous Owner | Foy Michael S | $146,400 | |
| Closed | Paravicini Nathalie Anne Veronique | $0 |
Source: Public Records
Tax History Compared to Growth
Tax History
| Year | Tax Paid | Tax Assessment Tax Assessment Total Assessment is a certain percentage of the fair market value that is determined by local assessors to be the total taxable value of land and additions on the property. | Land | Improvement |
|---|---|---|---|---|
| 2025 | $7,663 | $553,305 | $538,125 | $15,180 |
| 2024 | $7,663 | $508,803 | $448,438 | $60,365 |
| 2023 | $7,663 | $493,503 | $448,438 | $45,065 |
| 2022 | $10,222 | $464,246 | $422,813 | $41,433 |
| 2021 | $11,017 | $472,700 | $397,188 | $75,512 |
| 2020 | $10,801 | $495,606 | $397,188 | $98,418 |
| 2019 | $9,027 | $441,245 | $397,188 | $44,057 |
| 2018 | $6,296 | $324,318 | $269,063 | $55,255 |
| 2017 | $8,201 | $324,318 | $269,063 | $55,255 |
| 2016 | $7,613 | $324,318 | $269,063 | $55,255 |
| 2015 | $4,964 | $303,599 | $269,063 | $34,536 |
| 2014 | $4,964 | $257,779 | $217,813 | $39,966 |
Source: Public Records
Map
Nearby Homes
- 822 W 31st St
- 3203 Garden Oaks View
- 811 Sara Rose St
- 717 Sue Barnett Dr
- 1041 Gardendale Dr
- 804 W 27th St
- 765 Sue Barnett Dr
- 2653 Fountain Key Blvd
- 710 Sue Barnett Dr
- 1115 Gardendale Dr
- 2708 N Shepherd Dr
- 840 W 26th St
- 520 W 30th St
- 519 W 31st St
- 2524 Brinkman St Unit B
- 831 Wakefield Dr Unit A
- 837 W 25th St
- 524 W 34th St
- 824 & 828 W 32nd St
- 544 W 28th St