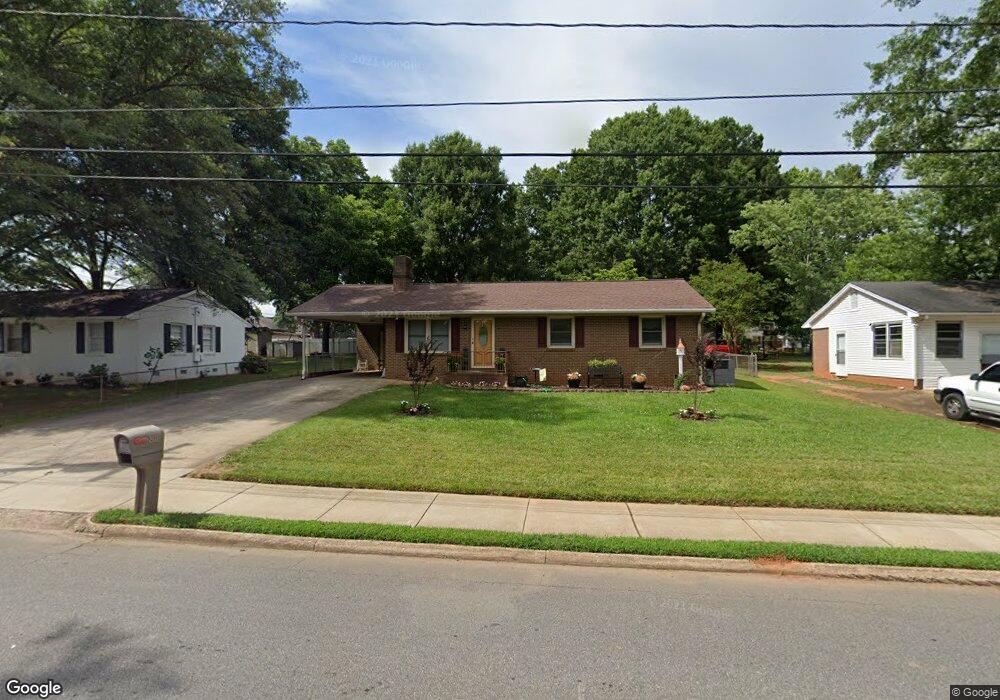
818 W Gold St Kings Mountain, NC 28086
Estimated Value: $160,188 - $209,000
--
Bed
--
Bath
1,092
Sq Ft
$179/Sq Ft
Est. Value
About This Home
This home is located at 818 W Gold St, Kings Mountain, NC 28086 and is currently estimated at $195,047, approximately $178 per square foot. 818 W Gold St is a home located in Cleveland County with nearby schools including West Elementary School, Kings Mountain Middle, and Kings Mountain Intermediate School.
Create a Home Valuation Report for This Property
The Home Valuation Report is an in-depth analysis detailing your home's value as well as a comparison with similar homes in the area
Home Values in the Area
Average Home Value in this Area
Tax History Compared to Growth
Tax History
| Year | Tax Paid | Tax Assessment Tax Assessment Total Assessment is a certain percentage of the fair market value that is determined by local assessors to be the total taxable value of land and additions on the property. | Land | Improvement |
|---|---|---|---|---|
| 2025 | $810 | $156,170 | $20,600 | $135,570 |
| 2024 | $541 | $88,730 | $17,468 | $71,262 |
| 2023 | $538 | $88,730 | $17,468 | $71,262 |
| 2022 | $516 | $88,730 | $17,468 | $71,262 |
| 2021 | $518 | $88,730 | $17,468 | $71,262 |
| 2020 | $409 | $69,200 | $17,468 | $51,732 |
| 2019 | $409 | $69,200 | $17,468 | $51,732 |
| 2018 | $408 | $69,200 | $17,468 | $51,732 |
| 2017 | $406 | $69,200 | $17,468 | $51,732 |
| 2016 | $407 | $69,200 | $17,468 | $51,732 |
| 2015 | $736 | $64,046 | $14,420 | $49,626 |
| 2014 | $736 | $64,046 | $14,420 | $49,626 |
Source: Public Records
Map
Nearby Homes
- 811 W Gold St Unit 26
- 440 Phifer Rd
- 442 Phifer Rd
- 208 Victoria Cir
- 1301 Shelby Rd
- 400 S Cansler St
- 300 N Watterson St
- 106 N Tracy St
- 316 S Cansler St
- 117 Parker Claire Ln
- 111 Parker Claire Ln
- 213 Parker Claire Ln
- 430 Fulton Dr
- 310 Campbell Cir
- 411 S Battleground Ave
- 524 Waco Rd
- 522 Waco Rd
- 1417 Merrimont Ave
- 1500 Shelby Rd
- 804 Lee St
- 820 W Gold St
- 816 W Gold St
- 900 W Gold St
- 813 W Mountain St
- 817 W Gold St
- 811 W Mountain St
- 815 W Gold St
- 813 W Gold St
- 809 W Mountain St
- 901 W Gold St
- 815 W Mountain St
- 807 W Mountain St
- 303 Silver St
- 304 Silver St
- 808 W Gold St
- 809 W Gold St
- 811 W Gold St
- 811 W Gold St Unit 21
- 811 W Gold St Unit 9
- 811 W Gold St Unit 15