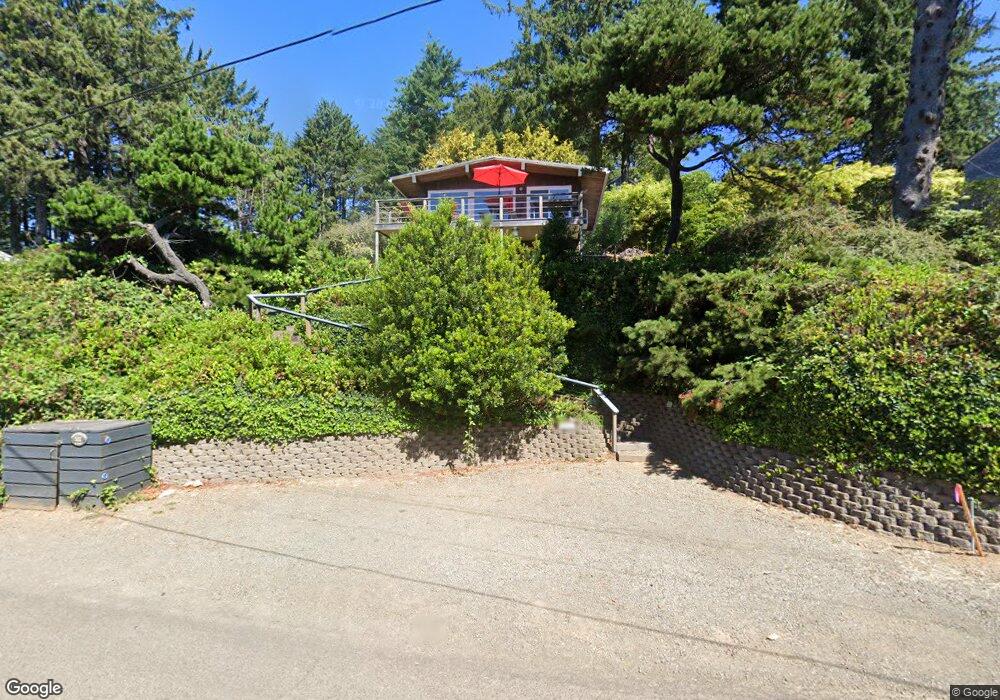
8180 Nehalem Rd Nehalem, OR 97131
Estimated Value: $657,000 - $892,000
2
Beds
2
Baths
1,344
Sq Ft
$584/Sq Ft
Est. Value
About This Home
This home is located at 8180 Nehalem Rd, Nehalem, OR 97131 and is currently estimated at $784,783, approximately $583 per square foot. 8180 Nehalem Rd is a home located in Tillamook County with nearby schools including Nehalem Elementary School, Garibaldi Elementary School, and Neah-Kah-Nie Middle School.
Ownership History
Date
Name
Owned For
Owner Type
Purchase Details
Closed on
Jan 14, 2022
Sold by
Justin Graham
Bought by
Lazy Pine Llc
Current Estimated Value
Purchase Details
Closed on
Nov 21, 2017
Sold by
Craney Kendyl Lou
Bought by
Graham Justin and Statz Pamela J
Home Financials for this Owner
Home Financials are based on the most recent Mortgage that was taken out on this home.
Original Mortgage
$342,400
Interest Rate
3.91%
Mortgage Type
New Conventional
Purchase Details
Closed on
Nov 17, 2017
Sold by
Craney Kendy Lou
Bought by
Graham Justin and Statz Pamela J
Home Financials for this Owner
Home Financials are based on the most recent Mortgage that was taken out on this home.
Original Mortgage
$342,400
Interest Rate
3.91%
Mortgage Type
New Conventional
Purchase Details
Closed on
Oct 10, 2016
Sold by
Vanzwol Jeffrey G and Lockhart Michelle M
Bought by
Craney Kendyl Lou
Purchase Details
Closed on
May 30, 2006
Sold by
Klein William H and Klein Dorothy J
Bought by
Vanzwol Jeffrey G and Lockhart Michelle M
Home Financials for this Owner
Home Financials are based on the most recent Mortgage that was taken out on this home.
Original Mortgage
$325,000
Interest Rate
6.52%
Mortgage Type
Fannie Mae Freddie Mac
Create a Home Valuation Report for This Property
The Home Valuation Report is an in-depth analysis detailing your home's value as well as a comparison with similar homes in the area
Purchase History
| Date | Buyer | Sale Price | Title Company |
|---|---|---|---|
| Lazy Pine Llc | -- | None Listed On Document | |
| Graham Justin | $87,000 | None Listed On Document | |
| Graham Justin | -- | Ticor Title | |
| Graham Justin | $428,000 | Ticor Title | |
| Craney Kendyl Lou | $430,000 | Ticor Title Company Of Or | |
| Vanzwol Jeffrey G | $425,000 | Ticor Title Ins Co |
Source: Public Records
Mortgage History
| Date | Status | Borrower | Loan Amount |
|---|---|---|---|
| Previous Owner | Graham Justin | $342,400 | |
| Previous Owner | Graham Justin | $342,400 | |
| Previous Owner | Vanzwol Jeffrey G | $325,000 |
Source: Public Records
Tax History
| Year | Tax Paid | Tax Assessment Tax Assessment Total Assessment is a certain percentage of the fair market value that is determined by local assessors to be the total taxable value of land and additions on the property. | Land | Improvement |
|---|---|---|---|---|
| 2025 | $3,943 | $313,050 | $186,270 | $126,780 |
| 2024 | $3,657 | $303,940 | $180,850 | $123,090 |
| 2023 | $3,623 | $295,090 | $175,580 | $119,510 |
| 2022 | $3,409 | $286,500 | $170,460 | $116,040 |
| 2021 | $3,308 | $278,160 | $165,490 | $112,670 |
| 2020 | $3,177 | $270,060 | $160,670 | $109,390 |
| 2019 | $3,088 | $262,200 | $156,000 | $106,200 |
| 2018 | $3,007 | $254,570 | $151,460 | $103,110 |
| 2017 | $2,922 | $247,160 | $147,050 | $100,110 |
| 2016 | $2,742 | $231,780 | $142,770 | $89,010 |
| 2015 | $2,691 | $225,030 | $138,610 | $86,420 |
| 2014 | $2,646 | $218,480 | $134,580 | $83,900 |
| 2013 | -- | $212,120 | $130,660 | $81,460 |
Source: Public Records
Map
Nearby Homes
- 0 Nehalem Rd Tax Lot 08808
- 0 Nehalem Rd Tl 08808
- 9330 Dewolf Rd
- 640 Ocean Rd
- 511 1st St
- 0 Tides Trail Unit Lot 45 462410636
- 45 Tides Trail
- 0 Vantage Rd Unit 623429248
- 0 Vantage Rd Unit 837025
- 62 Braeridge Dr
- Vantage Rd
- 0 Pine Ridge Dr Unit 24394081
- 0 Pine Ridge Dr Unit 141 24100339
- 0 Pine Ridge Dr Unit 147 24535382
- 0 Pine Ridge Dr Unit 71 24554922
- 0 Braeridge Dr Unit Lot 62 192646082
- 0 Braeridge Dr Unit 25-729
- 0 Laneda at 4th Place Unit 24456685
- 0 Laneda at 4th Place Unit 24-691
- 228 Beeswax Ln
- 8180 Nehalem Rd
- 8194 Nehalem Rd
- 8189 Nehalem Rd
- 8185 Nehalem Rd
- 8120 Nehalem Rd
- 8140 Nehalem Rd
- 37250 2nd St
- 37240 2nd St
- 37240 N 2nd St Unit ID1247570P
- 0 Vl 2nd St
- 0 Blackberry Ln Unit 11209582
- 8160 Nehalem Rd
- 8190 Nehalem Rd
- 8190 Nehalem Rd
- 37220 2nd St
- 8155 Nehalem Rd
- 37270 Second St
- 37270 2nd St
- 37270 N 2nd St
- 8175 Nehalem Rd
Your Personal Tour Guide
Ask me questions while you tour the home.