Estimated Value: $546,413 - $574,000
3
Beds
3
Baths
2,596
Sq Ft
$216/Sq Ft
Est. Value
About This Home
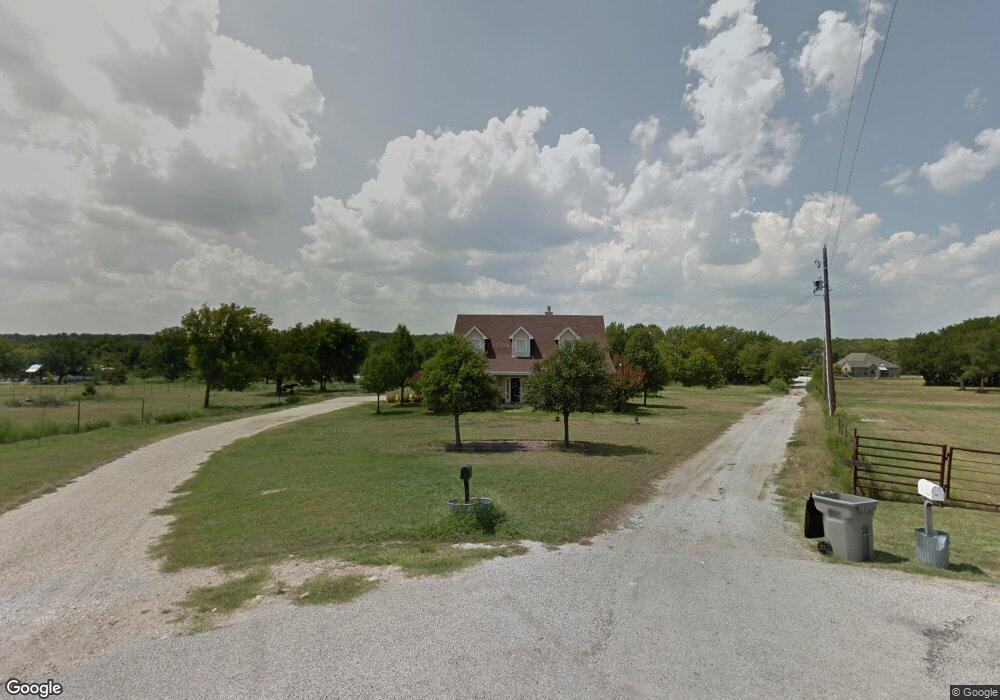
This home is located at 8181 Dodd Rd, Azle, TX 76020 and is currently estimated at $560,207, approximately $215 per square foot. 8181 Dodd Rd is a home located in Tarrant County with nearby schools including Silver Creek Elementary School, Azle Elementary School, and Azle Junior High School.
Ownership History
Date
Name
Owned For
Owner Type
Purchase Details
Closed on
Dec 20, 2018
Sold by
Ballard James D and Ballard Andrea L
Bought by
Bransford Kimberly and Bransford James
Current Estimated Value
Purchase Details
Closed on
Jun 15, 2012
Sold by
Kittrell Kevin and Kittrell Shawnie Shelly
Bought by
Ballard James D and Ballard Andrea L
Home Financials for this Owner
Home Financials are based on the most recent Mortgage that was taken out on this home.
Original Mortgage
$29,625
Interest Rate
3.8%
Mortgage Type
Purchase Money Mortgage
Purchase Details
Closed on
Mar 28, 2008
Sold by
Kittrell Toni Dea
Bought by
Kittrell Kevin
Home Financials for this Owner
Home Financials are based on the most recent Mortgage that was taken out on this home.
Original Mortgage
$181,861
Interest Rate
6.19%
Mortgage Type
Credit Line Revolving
Create a Home Valuation Report for This Property
The Home Valuation Report is an in-depth analysis detailing your home's value as well as a comparison with similar homes in the area
Home Values in the Area
Average Home Value in this Area
Purchase History
| Date | Buyer | Sale Price | Title Company |
|---|---|---|---|
| Bransford Kimberly | -- | Old Republic Title | |
| Ballard James D | -- | Capital Title | |
| Kittrell Kevin | -- | Commonwealth Land |
Source: Public Records
Mortgage History
| Date | Status | Borrower | Loan Amount |
|---|---|---|---|
| Previous Owner | Ballard James D | $29,625 | |
| Previous Owner | Ballard James D | $158,000 | |
| Previous Owner | Kittrell Kevin | $181,861 |
Source: Public Records
Tax History Compared to Growth
Tax History
| Year | Tax Paid | Tax Assessment Tax Assessment Total Assessment is a certain percentage of the fair market value that is determined by local assessors to be the total taxable value of land and additions on the property. | Land | Improvement |
|---|---|---|---|---|
| 2025 | $8,089 | $488,925 | $141,795 | $347,130 |
| 2024 | $8,089 | $488,925 | $141,795 | $347,130 |
| 2023 | $8,184 | $511,642 | $141,795 | $369,847 |
| 2022 | $8,302 | $444,163 | $101,795 | $342,368 |
| 2021 | $7,512 | $391,660 | $101,795 | $289,865 |
| 2020 | $6,838 | $356,532 | $124,295 | $232,237 |
| 2019 | $7,208 | $359,327 | $124,295 | $235,032 |
| 2018 | $5,274 | $279,479 | $124,295 | $155,184 |
| 2017 | $4,852 | $295,375 | $124,295 | $171,080 |
| 2016 | $4,411 | $230,973 | $124,495 | $106,478 |
| 2015 | $3,911 | $212,600 | $64,389 | $148,211 |
| 2014 | $3,911 | $212,600 | $64,389 | $148,211 |
Source: Public Records
Map
Nearby Homes
- 6942 Silver Creek Azle Rd
- 101 Deer Crossing Way
- 13041 Stacey Valley Dr
- 742 Boling Ranch Rd
- 145 Ranch Creek Dr
- 918 Boling Ranch Rd
- 2016 Adams Ln S
- 694 Boling Ranch Rd
- 2960 Flat Rock Rd
- 255 Chaparrals Run
- 7442 Cottonwood Creek Rd
- 528 Mill Creek Ct
- 1144 Rd
- 1144 Boling Ranch Rd N
- 125 Branding Iron Ct
- 1922 Walter Smith Rd
- 1917 Walter Smith Rd
- 129 Lariat Ct
- 1933 Walter Smith Rd
- 5944 Tenderfoot Trail
- 8180 Dodd Rd
- 8191 Dodd Rd
- 8191 Dodd Rd
- 8349 Dodd Rd
- 8321 Dodd Rd
- 8205 Dodd Rd
- TBD Dodd Rd
- 6801 Silver Creek Azle Rd
- 8375 Dodd Rd
- 8170 Dodd Rd
- 8139 Dodd Rd
- 6807 Silver Creek Azle Rd
- 6779 Silver Creek Azle Rd
- 8135 Dodd Rd
- 276 Gold Ln
- 8117 Dodd Rd
- 6803 Silver Creek Azle Rd
- 8348 Dodd Rd
- 286 Gold Ln
- 6805 Silver Creek Azle Rd