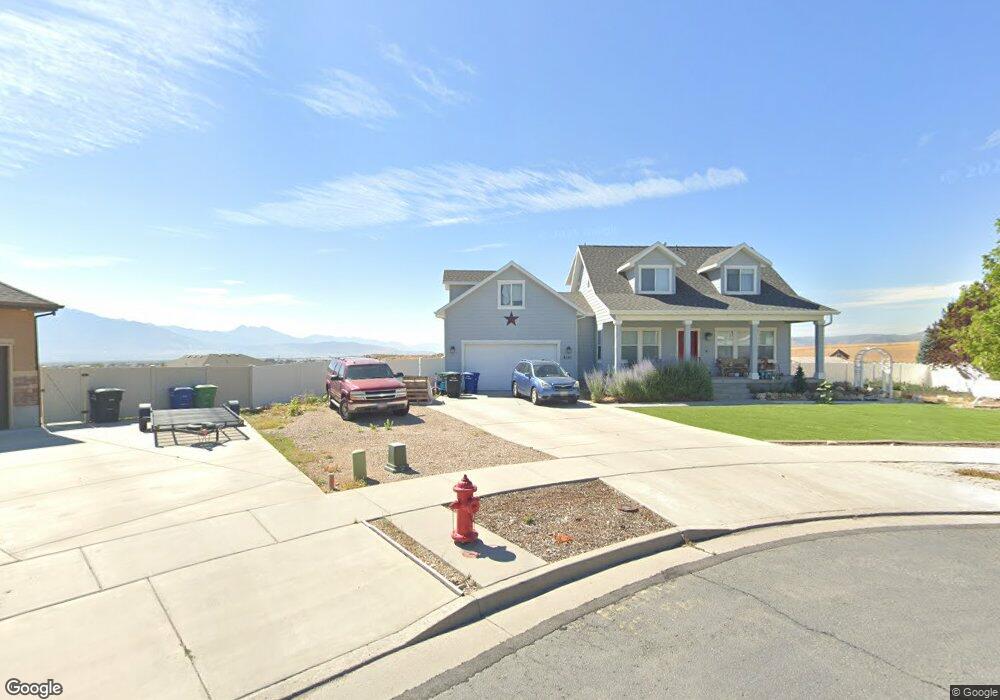
8181 S Chilwell Cove Unit 1101 West Jordan, UT 84081
Jordan Hills NeighborhoodEstimated Value: $801,656 - $818,000
4
Beds
3
Baths
2,179
Sq Ft
$372/Sq Ft
Est. Value
About This Home
This home is located at 8181 S Chilwell Cove Unit 1101, West Jordan, UT 84081 and is currently estimated at $810,414, approximately $371 per square foot. 8181 S Chilwell Cove Unit 1101 is a home located in Salt Lake County with nearby schools including Sunset Ridge Middle School, Copper Hills High School, and Ascent Academies of Utah West Jordan.
Ownership History
Date
Name
Owned For
Owner Type
Purchase Details
Closed on
Sep 22, 2020
Sold by
Winkler Vance W and Winkler Rebekha R
Bought by
Winkler Rebekah R and Winkler Vance W
Current Estimated Value
Home Financials for this Owner
Home Financials are based on the most recent Mortgage that was taken out on this home.
Original Mortgage
$190,000
Outstanding Balance
$135,587
Interest Rate
2.9%
Mortgage Type
New Conventional
Estimated Equity
$674,827
Purchase Details
Closed on
Feb 12, 2014
Sold by
Winkler Vance Wendell and Winkler Rebekah Richardson
Bought by
Winkler Vance W and Winkler Rebekah R
Home Financials for this Owner
Home Financials are based on the most recent Mortgage that was taken out on this home.
Original Mortgage
$233,923
Interest Rate
4.49%
Mortgage Type
VA
Purchase Details
Closed on
May 20, 2013
Sold by
Jordan Hills Villages Llc
Bought by
Best Management Practices Inc
Create a Home Valuation Report for This Property
The Home Valuation Report is an in-depth analysis detailing your home's value as well as a comparison with similar homes in the area
Home Values in the Area
Average Home Value in this Area
Purchase History
| Date | Buyer | Sale Price | Title Company |
|---|---|---|---|
| Winkler Rebekah R | -- | Stewart Title Ins Agcy Of Ut | |
| Winkler Vance W | -- | Access Title | |
| Best Management Practices Inc | -- | Metro National Title |
Source: Public Records
Mortgage History
| Date | Status | Borrower | Loan Amount |
|---|---|---|---|
| Open | Winkler Rebekah R | $190,000 | |
| Closed | Winkler Vance W | $233,923 |
Source: Public Records
Tax History Compared to Growth
Tax History
| Year | Tax Paid | Tax Assessment Tax Assessment Total Assessment is a certain percentage of the fair market value that is determined by local assessors to be the total taxable value of land and additions on the property. | Land | Improvement |
|---|---|---|---|---|
| 2025 | $1,773 | $735,300 | $276,200 | $459,100 |
| 2024 | $1,773 | $708,700 | $268,100 | $440,600 |
| 2023 | $1,838 | $682,100 | $257,900 | $424,200 |
| 2022 | $2,733 | $694,000 | $252,800 | $441,200 |
| 2021 | $3,260 | $529,400 | $199,100 | $330,300 |
| 2020 | $3,001 | $457,400 | $199,100 | $258,300 |
| 2019 | $2,952 | $441,100 | $199,100 | $242,000 |
| 2018 | $2,791 | $413,700 | $195,900 | $217,800 |
| 2017 | $2,647 | $390,700 | $195,900 | $194,800 |
| 2016 | $2,625 | $364,000 | $191,200 | $172,800 |
| 2015 | $2,722 | $368,000 | $194,800 | $173,200 |
| 2014 | $2,536 | $337,500 | $176,600 | $160,900 |
Source: Public Records
Map
Nearby Homes
- 8169 S Flaxton Ln
- 7171 W 8170 S
- 7143 W 8130 S
- 7106 W 7800 S Unit 250
- 7092 W Jayson Bend Dr
- 7953 S 7110 W
- 7182 Moorepark Place Unit 10
- 7169 Moorepark Place
- 7069 W Cottage Point Dr
- 7011 W Saw Timber Way
- 7009 W 7895 S
- Witzel Plan at The Sycamores
- Beatrix Plan at The Sycamores
- Sweetwater Plan at The Sycamores
- Princeton Plan at The Sycamores
- Dakota Plan at The Sycamores
- Dashell Plan at The Sycamores
- Roosevelt Plan at The Sycamores
- Wasatch Plan at The Sycamores
- 8494 S Otter Creek Dr
- 8163 S Chilwell Cove Unit 1026
- 8163 S Chilwell Cove
- 8164 S Chilwell Cove Unit 1025
- 8164 S Chilwell Cove
- 8164 S Chilwell Cove Unit 1025
- 8186 S Cricket Ln
- 8172 S Cricket Ln
- 8147 S Chilwell Cove Unit 1027
- 8147 S Chilwell Cove
- 8156 S Cricket Ln
- 8148 S Chilwell Cove
- 8148 Chilwell Cove
- 7423 Aberford Dr
- 7423 W Aberford Dr
- 8169 S Tukford Cir Unit 1104
- 8169 S Tukford Cir Unit 1104
- 8183 S Tukford Cir
- 8153 S Tukford Cir Unit 1103
- 8153 S Tukford Cir
- 8173 S Cricket Ln