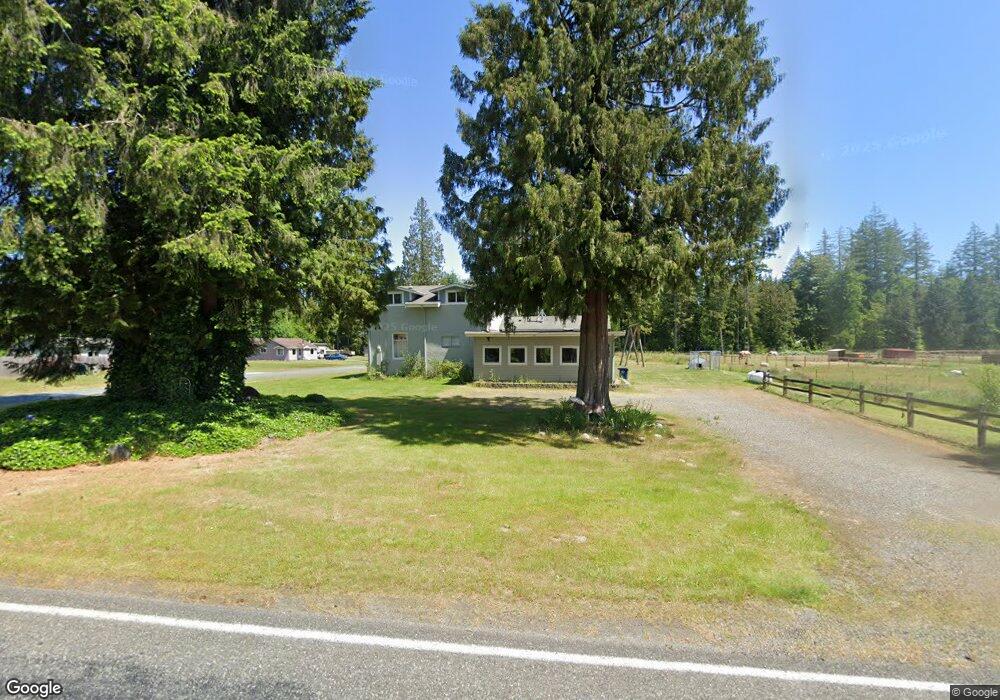
8186 Custer School Rd Custer, WA 98240
Estimated Value: $462,457 - $1,065,000
4
Beds
2
Baths
2,310
Sq Ft
$315/Sq Ft
Est. Value
About This Home
This home is located at 8186 Custer School Rd, Custer, WA 98240 and is currently estimated at $727,864, approximately $315 per square foot. 8186 Custer School Rd is a home located in Whatcom County with nearby schools including Custer Elementary School, Horizon Middle School, and Ferndale High School.
Ownership History
Date
Name
Owned For
Owner Type
Purchase Details
Closed on
Feb 8, 2023
Sold by
Ronald And Jeanne Arntzen Living Trust
Bought by
Granger Todd W
Current Estimated Value
Home Financials for this Owner
Home Financials are based on the most recent Mortgage that was taken out on this home.
Original Mortgage
$297,500
Outstanding Balance
$140,779
Interest Rate
6.48%
Mortgage Type
New Conventional
Estimated Equity
$587,085
Purchase Details
Closed on
Jan 19, 2022
Sold by
Arntzen Ronald F
Bought by
Amtzen Ronald Floyd and Amtzen Jeanne Marie
Purchase Details
Closed on
Feb 25, 2008
Sold by
Pacific Homes/Homequest Inc
Bought by
Arntzen Donald L and Arntzen Ronald F
Purchase Details
Closed on
Jul 13, 1999
Sold by
California Federal Bank Fsb
Bought by
Pacific Homes/Homequest Inc
Create a Home Valuation Report for This Property
The Home Valuation Report is an in-depth analysis detailing your home's value as well as a comparison with similar homes in the area
Purchase History
| Date | Buyer | Sale Price | Title Company |
|---|---|---|---|
| Granger Todd W | -- | Chicago Title | |
| Amtzen Ronald Floyd | -- | None Available | |
| Arntzen Donald L | $180,280 | Stewart Title Company | |
| Pacific Homes/Homequest Inc | -- | First American Title Ins Co |
Source: Public Records
Mortgage History
| Date | Status | Borrower | Loan Amount |
|---|---|---|---|
| Open | Granger Todd W | $297,500 |
Source: Public Records
Tax History
| Year | Tax Paid | Tax Assessment Tax Assessment Total Assessment is a certain percentage of the fair market value that is determined by local assessors to be the total taxable value of land and additions on the property. | Land | Improvement |
|---|---|---|---|---|
| 2025 | $3,993 | $543,456 | $245,410 | $298,046 |
| 2024 | $3,827 | $514,931 | $242,743 | $272,188 |
| 2023 | $3,827 | $536,719 | $275,000 | $261,719 |
| 2022 | $2,993 | $394,602 | $140,445 | $254,157 |
| 2021 | $3,043 | $326,116 | $116,070 | $210,046 |
| 2020 | $2,940 | $301,967 | $107,475 | $194,492 |
| 2019 | $2,365 | $263,005 | $93,608 | $169,397 |
| 2018 | $2,709 | $240,458 | $85,583 | $154,875 |
| 2017 | $2,478 | $210,724 | $75,000 | $135,724 |
| 2016 | $2,327 | $203,436 | $66,144 | $137,292 |
| 2015 | $2,341 | $191,467 | $62,622 | $128,845 |
| 2014 | -- | $187,521 | $61,200 | $126,321 |
| 2013 | -- | $184,947 | $60,000 | $124,947 |
Source: Public Records
Map
Nearby Homes
- 0 Portal Way
- 8085 Audra Ln
- 2948 Arnie Rd
- 0 Willeys Lake Rd Unit NWM2442375
- 8741 Delta Line Rd
- 8731 Valley View Rd
- 8306 Portal Way
- 3151 Velvet Ln
- 3179 Velvet Ln
- 2962 Haynie Rd
- 3824 Birch Bay Lynden Rd
- 3269 Haynie Rd
- 0 Valley View Lot 2 Rd Unit NWM2208210
- 8894 Giles Rd
- 7136 Portal Way Unit 18
- 7136 Portal Way
- 7475 Valley View Rd
- 9067 Sunrise Rd
- 1711 Garden Farms Rd
- 2966 Sweet Gum Loop
- 8198 Custer School Rd
- 8196 Custer School Rd
- 8170 Custer School Rd
- 8197 Custer School Rd
- 8171 Custer School Rd
- 8185 Custer School Rd
- 8209 Custer School Rd
- 8246 Custer School Rd
- 8134 Custer School Rd
- 2874 Birch Bay Lynden Rd
- 8213 Custer School Rd
- 8143 Custer School Rd
- 8260 Custer School Rd
- 8128 Custer School Rd
- 8183 Custer School Rd
- 2786 Birch Bay Lynden Rd
- 2840 Birch Bay Lynden Rd
- 8256 Custer School Rd
- 8259 Custer School Rd
- 8125 Custer School Rd
Your Personal Tour Guide
Ask me questions while you tour the home.