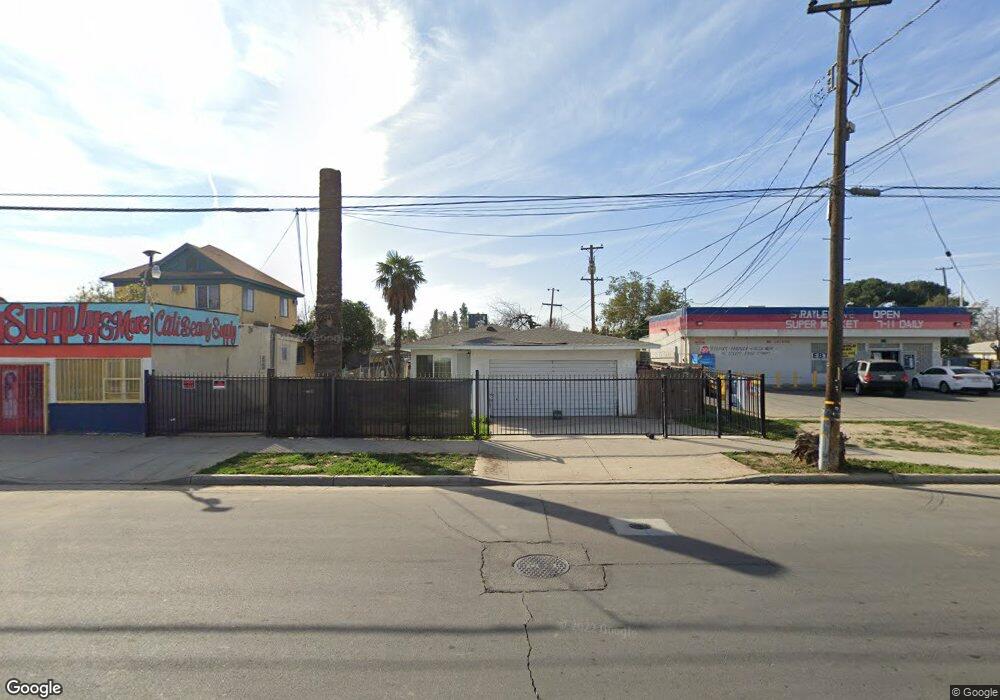
819 8th St Bakersfield, CA 93304
Oleander-Sunset NeighborhoodEstimated Value: $218,000 - $243,366
3
Beds
2
Baths
1,300
Sq Ft
$178/Sq Ft
Est. Value
About This Home
This home is located at 819 8th St, Bakersfield, CA 93304 and is currently estimated at $231,342, approximately $177 per square foot. 819 8th St is a home located in Kern County with nearby schools including McKinley Elementary School, Emerson Middle School, and Bakersfield High School.
Ownership History
Date
Name
Owned For
Owner Type
Purchase Details
Closed on
Jul 19, 2017
Sold by
Ali Bdoor Muslih and The Adam Jamail Muslih Ali Tru
Bought by
Ali Saleh Muslih and The Adam Jamail Muslih Ali Tru
Current Estimated Value
Purchase Details
Closed on
Mar 28, 2013
Sold by
Ali Nidal Muslih and Ali Nidal
Bought by
Ali Saleh Muslih
Purchase Details
Closed on
Oct 1, 2010
Sold by
Mershed Hind
Bought by
Ali Nidal
Purchase Details
Closed on
Sep 23, 2010
Sold by
Federal National Mortgage Association
Bought by
Ali Nidal
Purchase Details
Closed on
Jul 22, 2010
Sold by
Melendez Nellie
Bought by
Federal National Mortgage Association
Create a Home Valuation Report for This Property
The Home Valuation Report is an in-depth analysis detailing your home's value as well as a comparison with similar homes in the area
Home Values in the Area
Average Home Value in this Area
Purchase History
| Date | Buyer | Sale Price | Title Company |
|---|---|---|---|
| Ali Saleh Muslih | -- | None Available | |
| Ali Bdoor Muslih | -- | None Available | |
| Ali Saleh Muslih | -- | None Available | |
| Ali Nidal | -- | First American Title Ins Co | |
| Ali Nidal | $45,000 | First American Title Ins Co | |
| Federal National Mortgage Association | $222,330 | Accommodation |
Source: Public Records
Tax History
| Year | Tax Paid | Tax Assessment Tax Assessment Total Assessment is a certain percentage of the fair market value that is determined by local assessors to be the total taxable value of land and additions on the property. | Land | Improvement |
|---|---|---|---|---|
| 2025 | $1,757 | $91,022 | $34,133 | $56,889 |
| 2024 | $1,715 | $89,238 | $33,464 | $55,774 |
| 2023 | $1,715 | $87,489 | $32,808 | $54,681 |
| 2022 | $1,665 | $85,774 | $32,165 | $53,609 |
| 2021 | $1,564 | $84,093 | $31,535 | $52,558 |
| 2020 | $1,529 | $83,232 | $31,212 | $52,020 |
| 2019 | $1,500 | $83,232 | $31,212 | $52,020 |
| 2018 | $1,468 | $80,000 | $30,000 | $50,000 |
| 2017 | $1,342 | $68,965 | $21,219 | $47,746 |
| 2016 | $1,252 | $67,613 | $20,803 | $46,810 |
| 2015 | $1,240 | $66,598 | $20,491 | $46,107 |
| 2014 | $1,201 | $65,294 | $20,090 | $45,204 |
Source: Public Records
Map
Nearby Homes
Your Personal Tour Guide
Ask me questions while you tour the home.