Estimated Value: $86,000 - $110,137
3
Beds
1
Bath
1,442
Sq Ft
$71/Sq Ft
Est. Value
About This Home
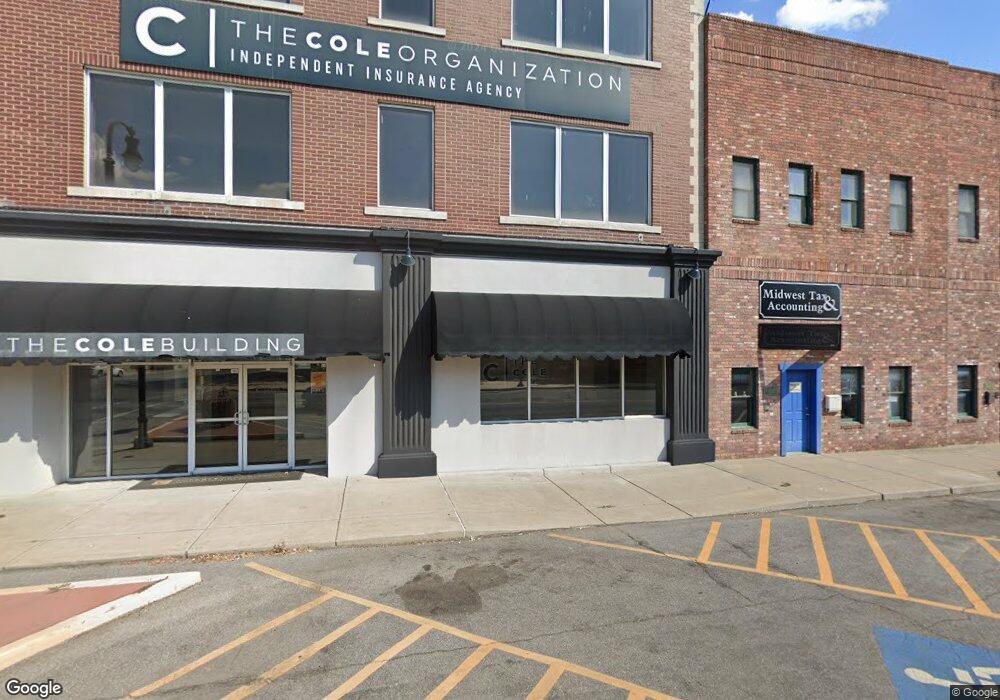
This home is located at 819 C St NW, Miami, OK 74354 and is currently estimated at $102,534, approximately $71 per square foot. 819 C St NW is a home located in Ottawa County with nearby schools including Miami High School and Mt. Olive Lutheran School.
Ownership History
Date
Name
Owned For
Owner Type
Purchase Details
Closed on
Feb 21, 2025
Sold by
R An Dy Rentals Llc
Bought by
Par H Investments Llc
Current Estimated Value
Purchase Details
Closed on
Apr 3, 2014
Bought by
R An Dy Rentals Llc
Purchase Details
Closed on
Jan 16, 2014
Bought by
Us Bank National Associat
Purchase Details
Closed on
Jul 23, 1997
Bought by
Taylor Robert and Taylor Lorraine
Purchase Details
Closed on
Feb 25, 1997
Bought by
Ferris Kenneth and Ferris Janice
Create a Home Valuation Report for This Property
The Home Valuation Report is an in-depth analysis detailing your home's value as well as a comparison with similar homes in the area
Home Values in the Area
Average Home Value in this Area
Purchase History
| Date | Buyer | Sale Price | Title Company |
|---|---|---|---|
| Par H Investments Llc | $98,000 | Ottawa County Abstract & Title | |
| Par H Investments Llc | $98,000 | Ottawa County Abstract & Title | |
| R An Dy Rentals Llc | $10,500 | -- | |
| Us Bank National Associat | -- | -- | |
| Taylor Robert | $29,000 | -- | |
| Ferris Kenneth | $19,000 | -- |
Source: Public Records
Tax History Compared to Growth
Tax History
| Year | Tax Paid | Tax Assessment Tax Assessment Total Assessment is a certain percentage of the fair market value that is determined by local assessors to be the total taxable value of land and additions on the property. | Land | Improvement |
|---|---|---|---|---|
| 2025 | $561 | $6,108 | $550 | $5,558 |
| 2024 | $561 | $5,818 | $524 | $5,294 |
| 2023 | $561 | $5,541 | $519 | $5,022 |
| 2022 | $488 | $5,277 | $514 | $4,763 |
| 2021 | $475 | $5,026 | $509 | $4,517 |
| 2020 | $456 | $4,787 | $505 | $4,282 |
| 2019 | $374 | $4,558 | $498 | $4,060 |
| 2018 | $359 | $4,342 | $494 | $3,848 |
| 2017 | $347 | $4,135 | $490 | $3,645 |
| 2016 | $316 | $3,938 | $486 | $3,452 |
| 2015 | $285 | $3,207 | $510 | $2,697 |
| 2014 | $225 | $3,751 | $463 | $3,288 |
Source: Public Records
Map
Nearby Homes