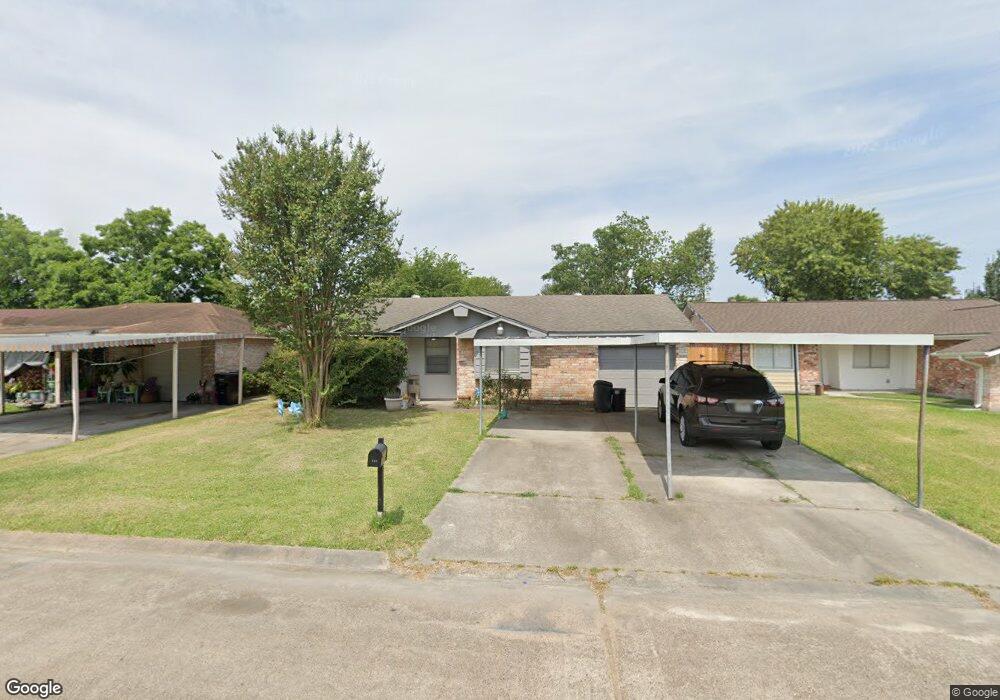
819 Donfield St Channelview, TX 77530
Estimated Value: $176,105 - $202,000
3
Beds
2
Baths
1,099
Sq Ft
$168/Sq Ft
Est. Value
About This Home
This home is located at 819 Donfield St, Channelview, TX 77530 and is currently estimated at $184,526, approximately $167 per square foot. 819 Donfield St is a home located in Harris County with nearby schools including Channelview High School and Family Christian Academy.
Ownership History
Date
Name
Owned For
Owner Type
Purchase Details
Closed on
Sep 22, 2014
Sold by
Arreola Gerardo
Bought by
Arreola Ernestina D
Current Estimated Value
Purchase Details
Closed on
Aug 16, 2011
Sold by
Moreno Angelica
Bought by
Federal National Mortgage Association
Purchase Details
Closed on
Jul 5, 2011
Sold by
Moreno Angelica
Bought by
Federal National Mortgage Association
Purchase Details
Closed on
Apr 17, 2006
Sold by
Acevedo Rogel N and Acevedo Maria I
Bought by
Moreno Angelica
Home Financials for this Owner
Home Financials are based on the most recent Mortgage that was taken out on this home.
Original Mortgage
$85,000
Interest Rate
6.32%
Mortgage Type
Purchase Money Mortgage
Purchase Details
Closed on
Nov 11, 1998
Sold by
Norwest Mtg Inc
Bought by
Va
Purchase Details
Closed on
Nov 3, 1998
Sold by
Fain Billy Marvin
Bought by
Norwest Mtg Inc
Create a Home Valuation Report for This Property
The Home Valuation Report is an in-depth analysis detailing your home's value as well as a comparison with similar homes in the area
Home Values in the Area
Average Home Value in this Area
Purchase History
| Date | Buyer | Sale Price | Title Company |
|---|---|---|---|
| Arreola Ernestina D | -- | None Available | |
| Federal National Mortgage Association | -- | None Available | |
| Federal National Mortgage Association | $70,569 | None Available | |
| Moreno Angelica | -- | Alamo Title Company | |
| Va | -- | -- | |
| Norwest Mtg Inc | $37,796 | -- |
Source: Public Records
Mortgage History
| Date | Status | Borrower | Loan Amount |
|---|---|---|---|
| Previous Owner | Moreno Angelica | $85,000 |
Source: Public Records
Tax History Compared to Growth
Tax History
| Year | Tax Paid | Tax Assessment Tax Assessment Total Assessment is a certain percentage of the fair market value that is determined by local assessors to be the total taxable value of land and additions on the property. | Land | Improvement |
|---|---|---|---|---|
| 2025 | $1,575 | $154,379 | $33,893 | $120,486 |
| 2024 | $1,575 | $153,225 | $33,893 | $119,332 |
| 2023 | $1,575 | $163,210 | $33,893 | $129,317 |
| 2022 | $3,606 | $137,904 | $33,893 | $104,011 |
| 2021 | $3,422 | $116,978 | $33,893 | $83,085 |
| 2020 | $3,394 | $109,511 | $30,920 | $78,591 |
| 2019 | $3,175 | $108,181 | $30,920 | $77,261 |
| 2018 | $1,255 | $89,913 | $23,785 | $66,128 |
| 2017 | $2,898 | $89,913 | $23,785 | $66,128 |
| 2016 | $2,517 | $78,088 | $23,785 | $54,303 |
| 2015 | $1,339 | $65,981 | $14,568 | $51,413 |
| 2014 | $1,339 | $57,766 | $14,568 | $43,198 |
Source: Public Records
Map
Nearby Homes
- 730 Doncrest St
- 827 Dondell St
- 727 Doncrest St
- 814 Deercrest St
- 707 Doncrest St
- 15122 Sheffield Terrace
- 830 Stonyridge St
- 15014 Groveshire St
- 730 Stonyridge St
- 707 Terryhollow St
- 726 Brookview St
- 826 Ivy Hollow St
- 714 Ivy Hollow St
- 1034 Littleport Ln
- 722 Canna St
- 15225 Woodforest Blvd
- 1123 Maclesby Ln
- 1102 Heathfield Dr
- 634 Bright Penny Ln
- 910 Calm Creek Ct
- 823 Donfield St
- 815 Donfield St
- 818 Doncrest St
- 811 Donfield St
- 827 Donfield St
- 814 Doncrest St
- 822 Doncrest St
- 810 Doncrest St
- 826 Doncrest St
- 818 Donfield St
- 807 Donfield St
- 822 Donfield St
- 814 Donfield St
- 831 Donfield St
- 806 Doncrest St
- 826 Donfield St
- 810 Donfield St
- 830 Doncrest St
- 803 Donfield St
- 806 Donfield St