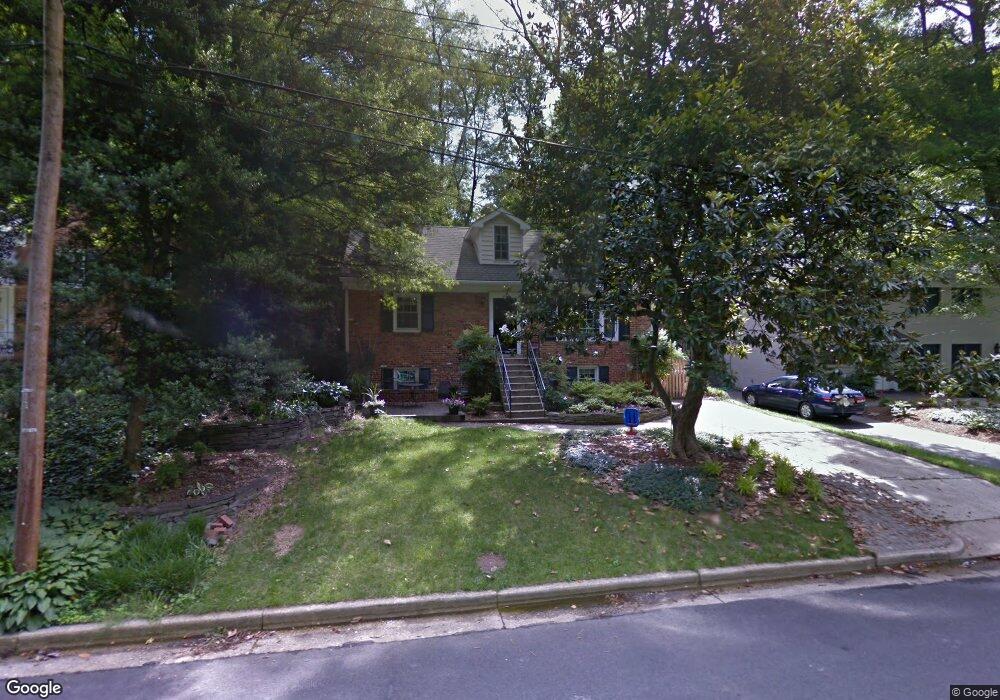
819 E Timber Branch Pkwy Alexandria, VA 22302
North Ridge NeighborhoodEstimated Value: $1,182,000 - $1,261,000
4
Beds
3
Baths
2,170
Sq Ft
$562/Sq Ft
Est. Value
About This Home
This home is located at 819 E Timber Branch Pkwy, Alexandria, VA 22302 and is currently estimated at $1,219,780, approximately $562 per square foot. 819 E Timber Branch Pkwy is a home located in Alexandria City with nearby schools including Douglas Macarthur Elementary School, George Washington Middle School, and Alexandria City High School.
Ownership History
Date
Name
Owned For
Owner Type
Purchase Details
Closed on
Jun 6, 2005
Sold by
Merrick Mark
Bought by
Nolan Daniel
Current Estimated Value
Home Financials for this Owner
Home Financials are based on the most recent Mortgage that was taken out on this home.
Original Mortgage
$590,000
Outstanding Balance
$308,610
Interest Rate
5.79%
Mortgage Type
New Conventional
Estimated Equity
$911,170
Purchase Details
Closed on
Mar 3, 1998
Sold by
Skaggs Pitts Charles D and Skaggs Pitts Marianne E
Bought by
Merrick Jo M
Home Financials for this Owner
Home Financials are based on the most recent Mortgage that was taken out on this home.
Original Mortgage
$227,150
Interest Rate
6.85%
Mortgage Type
New Conventional
Create a Home Valuation Report for This Property
The Home Valuation Report is an in-depth analysis detailing your home's value as well as a comparison with similar homes in the area
Home Values in the Area
Average Home Value in this Area
Purchase History
| Date | Buyer | Sale Price | Title Company |
|---|---|---|---|
| Nolan Daniel | $790,000 | -- | |
| Merrick Jo M | $288,000 | -- |
Source: Public Records
Mortgage History
| Date | Status | Borrower | Loan Amount |
|---|---|---|---|
| Open | Nolan Daniel | $590,000 | |
| Previous Owner | Merrick Jo M | $227,150 |
Source: Public Records
Tax History Compared to Growth
Tax History
| Year | Tax Paid | Tax Assessment Tax Assessment Total Assessment is a certain percentage of the fair market value that is determined by local assessors to be the total taxable value of land and additions on the property. | Land | Improvement |
|---|---|---|---|---|
| 2025 | $13,540 | $1,143,033 | $632,955 | $510,078 |
| 2024 | $13,540 | $1,120,991 | $620,537 | $500,454 |
| 2023 | $11,866 | $1,068,985 | $590,987 | $477,998 |
| 2022 | $11,365 | $1,023,896 | $562,798 | $461,098 |
| 2021 | $10,490 | $945,086 | $526,201 | $418,885 |
| 2020 | $10,800 | $928,421 | $519,278 | $409,143 |
| 2019 | $10,007 | $885,584 | $484,659 | $400,925 |
| 2018 | $9,542 | $844,458 | $469,823 | $374,635 |
| 2017 | $9,567 | $846,649 | $469,823 | $376,826 |
| 2016 | $9,085 | $846,649 | $469,823 | $376,826 |
| 2015 | $8,525 | $817,381 | $420,368 | $397,013 |
| 2014 | $8,642 | $828,581 | $375,858 | $452,723 |
Source: Public Records
Map
Nearby Homes
- 811 E Timber Branch Pkwy
- 903 E Timber Branch Pkwy
- 2401 Ridge Road Dr
- 2409 Cameron Mills Rd
- 2929 Eddington Terrace
- 509 Lloyds Ln
- 2911 Eddington Terrace
- 2732 Franklin Ct
- 2722 Franklin Ct
- 917 Crestwood Dr
- 320 -1/2 Mansion Dr
- 1306 Bishop Ln
- 604 Crestwood Dr
- 1735 W Braddock Place Unit 302
- 620 Melrose St
- 1730 Osage St
- 2700 Bryan Place
- 1121 Allison St
- 1002 Beverley Dr
- 1503 Russell Rd
- 821 E Timber Branch Pkwy
- 817 E Timber Branch Pkwy
- 815 E Timber Branch Pkwy
- 823 E Timber Branch Pkwy
- 822 Fontaine St
- 826 Fontaine St
- 820 Fontaine St
- 813 E Timber Branch Pkwy
- 825 E Timber Branch Pkwy
- 832 Fontaine St
- 810 Fontaine St
- 901 E Timber Branch Pkwy
- 834 Fontaine St
- 809 E Timber Branch Pkwy
- 816 W Timber Branch Pkwy
- 820 W Timber Branch Pkwy
- 818 W Timber Branch Pkwy
- 815 Fontaine St
- 806 Fontaine St
- 821 Fontaine St