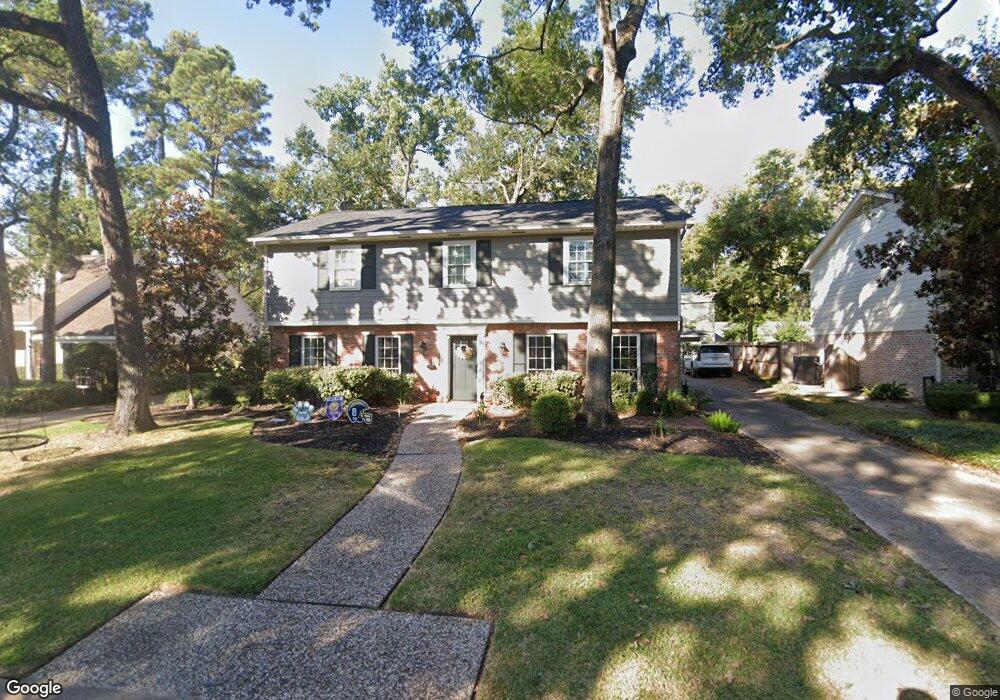
819 Glenchester St Houston, TX 77079
Memorial NeighborhoodEstimated Value: $1,086,165 - $1,189,000
5
Beds
3
Baths
2,835
Sq Ft
$394/Sq Ft
Est. Value
About This Home
This home is located at 819 Glenchester St, Houston, TX 77079 and is currently estimated at $1,116,291, approximately $393 per square foot. 819 Glenchester St is a home located in Harris County with nearby schools including Wilchester Elementary School, Memorial Middle, and Stratford High School.
Ownership History
Date
Name
Owned For
Owner Type
Purchase Details
Closed on
Oct 30, 2020
Sold by
Buri John and Buri Kami
Bought by
Day Michael and Day Jennifer
Current Estimated Value
Home Financials for this Owner
Home Financials are based on the most recent Mortgage that was taken out on this home.
Original Mortgage
$624,000
Outstanding Balance
$556,268
Interest Rate
2.9%
Mortgage Type
New Conventional
Estimated Equity
$560,023
Purchase Details
Closed on
May 24, 2012
Sold by
Cheesman Dale C and Cheesman Stacy Scott
Bought by
Buri John and Buri Kami
Home Financials for this Owner
Home Financials are based on the most recent Mortgage that was taken out on this home.
Original Mortgage
$59,000
Interest Rate
3.9%
Mortgage Type
New Conventional
Purchase Details
Closed on
May 5, 1997
Sold by
Reily Mark H and Reily Jane
Bought by
Cheesman Dale C and Cheesman Stacy Scott
Home Financials for this Owner
Home Financials are based on the most recent Mortgage that was taken out on this home.
Original Mortgage
$187,500
Interest Rate
8.12%
Create a Home Valuation Report for This Property
The Home Valuation Report is an in-depth analysis detailing your home's value as well as a comparison with similar homes in the area
Home Values in the Area
Average Home Value in this Area
Purchase History
| Date | Buyer | Sale Price | Title Company |
|---|---|---|---|
| Day Michael | -- | None Listed On Document | |
| Day Michael | -- | None Listed On Document | |
| Buri John | -- | Old Republic National Title | |
| Cheesman Dale C | -- | -- |
Source: Public Records
Mortgage History
| Date | Status | Borrower | Loan Amount |
|---|---|---|---|
| Open | Day Michael | $624,000 | |
| Closed | Day Michael | $624,000 | |
| Previous Owner | Buri John | $59,000 | |
| Previous Owner | Cheesman Dale C | $187,500 | |
| Closed | Cheesman Dale C | $37,500 |
Source: Public Records
Tax History Compared to Growth
Tax History
| Year | Tax Paid | Tax Assessment Tax Assessment Total Assessment is a certain percentage of the fair market value that is determined by local assessors to be the total taxable value of land and additions on the property. | Land | Improvement |
|---|---|---|---|---|
| 2025 | $16,725 | $1,125,807 | $549,000 | $576,807 |
| 2024 | $16,725 | $1,009,463 | $549,000 | $460,463 |
| 2023 | $16,725 | $975,000 | $549,000 | $426,000 |
| 2022 | $20,204 | $864,191 | $521,550 | $342,641 |
| 2021 | $19,197 | $786,281 | $503,250 | $283,031 |
| 2020 | $18,792 | $750,000 | $503,250 | $246,750 |
| 2019 | $19,208 | $753,852 | $503,250 | $250,602 |
| 2018 | $6,528 | $667,000 | $503,250 | $163,750 |
| 2017 | $19,098 | $730,000 | $503,250 | $226,750 |
| 2016 | $19,137 | $808,815 | $503,250 | $305,565 |
| 2015 | $12,663 | $808,815 | $503,250 | $305,565 |
| 2014 | $12,663 | $0 | $0 | $0 |
Source: Public Records
Map
Nearby Homes
- 710 Patchester Dr
- 807 Wycliffe Dr
- 807 Patchester Dr
- 13403 Taylorcrest Rd
- 903 Wycliffe Dr
- 13131 Kimberley Ln
- 13931 Kingsride Ln
- 866 Myrtlea Ln
- 1110 W Tri Oaks Ln Unit 157
- 1108 W Tri Oaks Ln Unit 150
- 11102 Savannah Oaks Ln
- 11411 Ash Creek Dr
- 11402 Ash Creek Dr
- 881 Wax Myrtle Ln Unit A
- 1113 Sherwood Trail
- 1129 Sherwood Run
- 11027 Acorn Falls Dr
- 11005 Acorn Falls Dr
- 11116 Sherwood Oak Ln
- 939 Wax Myrtle Ln
- 819 Glenchester Dr
- 815 Glenchester St
- 823 Glenchester St
- 802 Barryknoll Ct
- 806 Barryknoll Ct
- 811 Glenchester St
- 827 Glenchester St
- 13518 Queensbury Ln
- 810 Barryknoll Ct
- 13602 Queensbury Ln
- 13519 Barryknoll Ln
- 807 Glenchester St
- 13519 Queensbury Ln
- 13606 Queensbury Ln
- 13514 Queensbury Ln
- 13515 Barryknoll Ln
- 13515 Queensbury Ln
- 835 Glenchester St
- 13610 Queensbury Ln
- 807 Barryknoll Ct