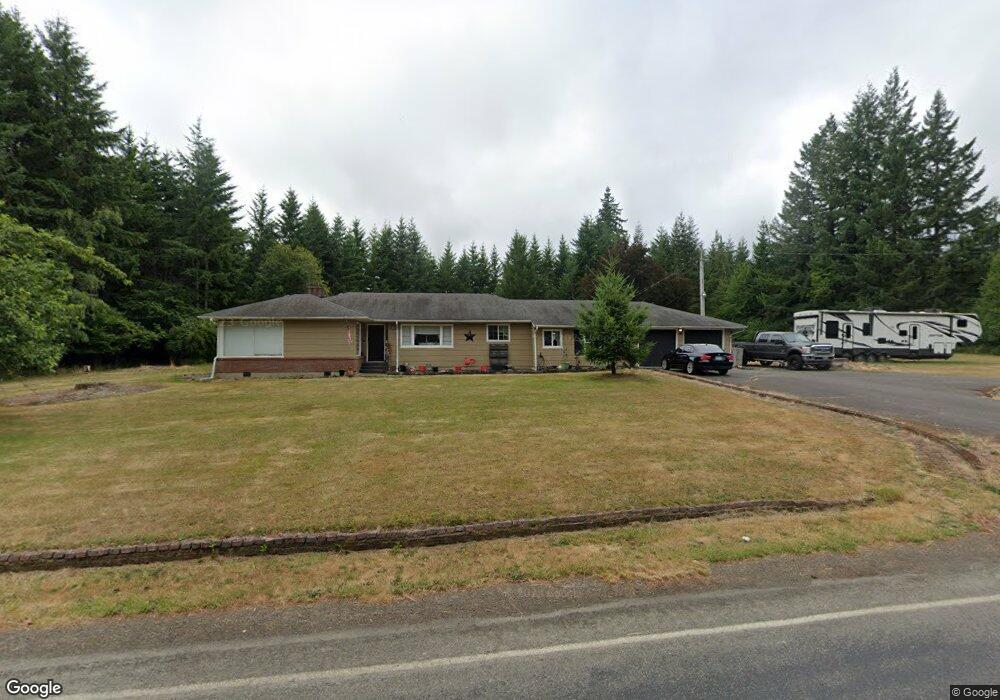
819 King Rd Winlock, WA 98596
Estimated Value: $332,000 - $527,000
3
Beds
2
Baths
2,424
Sq Ft
$194/Sq Ft
Est. Value
About This Home
This home is located at 819 King Rd, Winlock, WA 98596 and is currently estimated at $470,806, approximately $194 per square foot. 819 King Rd is a home located in Lewis County with nearby schools including Winlock Miller Elementary School, Winolequa Learning Academy, and Winlock Middle School.
Ownership History
Date
Name
Owned For
Owner Type
Purchase Details
Closed on
Feb 7, 2025
Sold by
Lamb Paul and Lamb Yvonne
Bought by
Nixon Eric and Nixon Julie
Current Estimated Value
Purchase Details
Closed on
Dec 1, 2020
Sold by
Wolff Yvonne
Bought by
Nixon Eric and Nixon Julie
Home Financials for this Owner
Home Financials are based on the most recent Mortgage that was taken out on this home.
Original Mortgage
$150,000
Interest Rate
4%
Mortgage Type
Land Contract Argmt. Of Sale
Purchase Details
Closed on
Aug 1, 2018
Sold by
Nixon Eric
Bought by
Wolff Yvonne
Home Financials for this Owner
Home Financials are based on the most recent Mortgage that was taken out on this home.
Original Mortgage
$119,000
Interest Rate
4%
Mortgage Type
Land Contract Argmt. Of Sale
Purchase Details
Closed on
Jan 30, 2012
Sold by
Nixon Marla
Bought by
Nixon Eric J
Purchase Details
Closed on
Jul 24, 2008
Sold by
Leininger Joel P
Bought by
Nixon Eric and Nixon Marla
Home Financials for this Owner
Home Financials are based on the most recent Mortgage that was taken out on this home.
Original Mortgage
$198,000
Interest Rate
6.41%
Mortgage Type
Seller Take Back
Create a Home Valuation Report for This Property
The Home Valuation Report is an in-depth analysis detailing your home's value as well as a comparison with similar homes in the area
Home Values in the Area
Average Home Value in this Area
Purchase History
| Date | Buyer | Sale Price | Title Company |
|---|---|---|---|
| Nixon Eric | $195,556 | None Listed On Document | |
| Nixon Eric | $165,000 | None Available | |
| Wolff Yvonne | $119,000 | None Available | |
| Nixon Eric J | -- | None Available | |
| Nixon Eric | $200,000 | None Available |
Source: Public Records
Mortgage History
| Date | Status | Borrower | Loan Amount |
|---|---|---|---|
| Previous Owner | Nixon Eric | $150,000 | |
| Previous Owner | Wolff Yvonne | $119,000 | |
| Previous Owner | Nixon Eric | $198,000 |
Source: Public Records
Tax History Compared to Growth
Tax History
| Year | Tax Paid | Tax Assessment Tax Assessment Total Assessment is a certain percentage of the fair market value that is determined by local assessors to be the total taxable value of land and additions on the property. | Land | Improvement |
|---|---|---|---|---|
| 2025 | $3,097 | $417,700 | $89,800 | $327,900 |
| 2024 | $3,097 | $430,700 | $80,100 | $350,600 |
| 2023 | $2,994 | $401,400 | $65,400 | $336,000 |
| 2022 | $2,887 | $310,600 | $51,400 | $259,200 |
| 2021 | $2,704 | $310,600 | $51,400 | $259,200 |
| 2020 | $2,768 | $265,700 | $45,000 | $220,700 |
| 2019 | $2,835 | $253,800 | $38,600 | $215,200 |
| 2018 | $2,699 | $251,200 | $33,900 | $217,300 |
| 2017 | $2,462 | $219,600 | $33,900 | $185,700 |
| 2016 | $2,313 | $208,900 | $30,300 | $178,600 |
| 2015 | $2,418 | $192,700 | $30,300 | $162,400 |
| 2013 | $2,418 | $223,900 | $38,900 | $185,000 |
Source: Public Records
Map
Nearby Homes
- 0 Byham Rd Unit NWM2430308
- 1003 NW Dexter Ave
- 701 NW Dexter Ave
- 863 Byham Rd
- 903 Byham Rd
- 109 Laurel St
- 915 NW Kerron St
- 0 NE 1st St
- 811 NE 2nd St
- 2768 Highway 603
- 418 SW Canyon Loop
- 0 XX NE 2nd St
- 107 Winwood Ln
- 219 Jones Rd
- 0 SW Alder St
- 0 Cemetary Rd
- 212 SE Cowlitz Rd
- 911 SW Front St
- 0 LOT B-D SE Korpi Way
- 0 SE Rice-Multiple Mdr Ldr Parcels