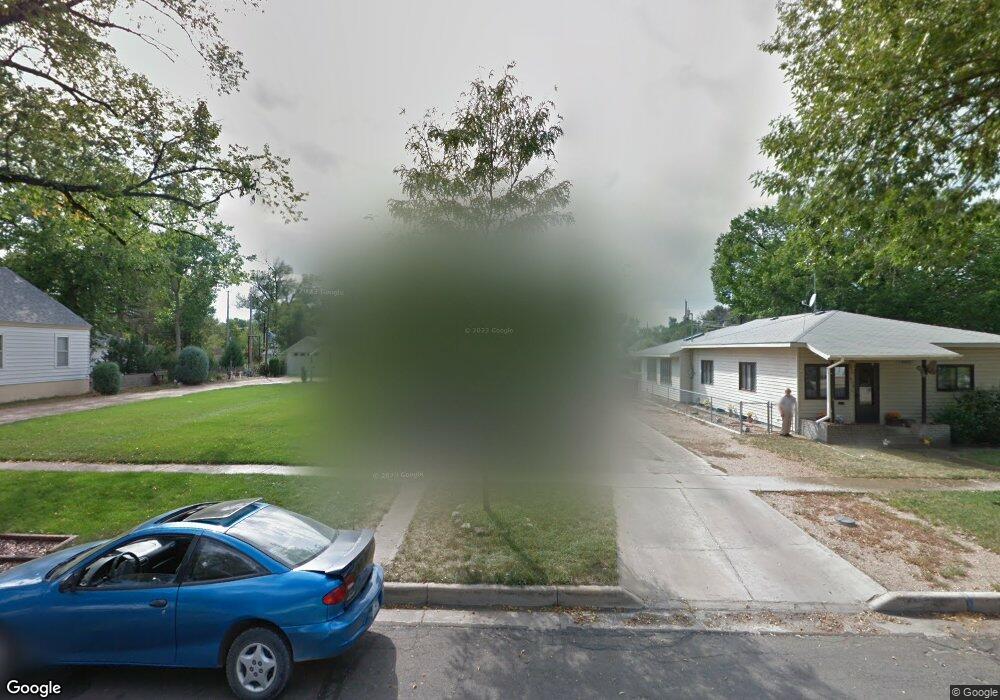
819 Meeker St Fort Morgan, CO 80701
Estimated Value: $215,000 - $241,258
2
Beds
1
Bath
1,277
Sq Ft
$180/Sq Ft
Est. Value
About This Home
This home is located at 819 Meeker St, Fort Morgan, CO 80701 and is currently estimated at $229,565, approximately $179 per square foot. 819 Meeker St is a home located in Morgan County with nearby schools including Fort Morgan High School, Trinity Lutheran School, and Lighthouse Seventh-day Adventist Christian School.
Ownership History
Date
Name
Owned For
Owner Type
Purchase Details
Closed on
Jul 13, 2022
Sold by
Schwenke Dawn C
Bought by
Fnf Properties
Current Estimated Value
Purchase Details
Closed on
Jun 29, 2022
Sold by
Schwenke Dawn C
Bought by
Lending Group Inc
Purchase Details
Closed on
Feb 28, 2009
Sold by
Dunn Willard L
Bought by
Schwenke Dawn C
Purchase Details
Closed on
Sep 17, 2008
Sold by
Schwenke Dawn C
Bought by
Schwenke Dawn C and Dunn Willard L
Create a Home Valuation Report for This Property
The Home Valuation Report is an in-depth analysis detailing your home's value as well as a comparison with similar homes in the area
Home Values in the Area
Average Home Value in this Area
Purchase History
| Date | Buyer | Sale Price | Title Company |
|---|---|---|---|
| Fnf Properties | -- | None Listed On Document | |
| Lending Group Inc | $100,800 | None Listed On Document | |
| Schwenke Dawn C | -- | None Available | |
| Schwenke Dawn C | -- | None Available |
Source: Public Records
Tax History Compared to Growth
Tax History
| Year | Tax Paid | Tax Assessment Tax Assessment Total Assessment is a certain percentage of the fair market value that is determined by local assessors to be the total taxable value of land and additions on the property. | Land | Improvement |
|---|---|---|---|---|
| 2024 | $984 | $12,290 | $2,410 | $9,880 |
| 2023 | $984 | $15,970 | $3,130 | $12,840 |
| 2022 | $937 | $11,430 | $3,060 | $8,370 |
| 2021 | $1,380 | $11,770 | $3,150 | $8,620 |
| 2020 | $868 | $10,290 | $3,000 | $7,290 |
| 2019 | $869 | $10,290 | $3,000 | $7,290 |
| 2018 | $638 | $7,440 | $2,420 | $5,020 |
| 2017 | $638 | $7,440 | $2,420 | $5,020 |
| 2016 | $602 | $6,950 | $2,090 | $4,860 |
| 2015 | $593 | $6,950 | $2,090 | $4,860 |
| 2014 | $558 | $6,380 | $1,670 | $4,710 |
| 2013 | -- | $6,380 | $1,670 | $4,710 |
Source: Public Records
Map
Nearby Homes