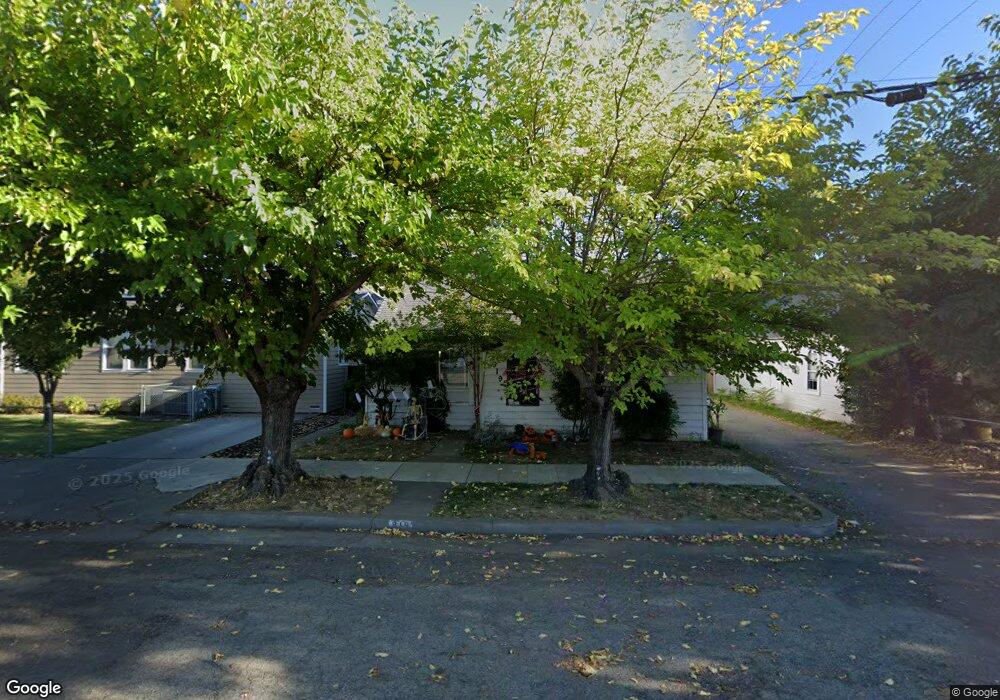
819 Pine St Red Bluff, CA 96080
Estimated Value: $242,000 - $338,000
About This Home
This home is located at 819 Pine St, Red Bluff, CA 96080 and is currently estimated at $281,399, approximately $166 per square foot. 819 Pine St is a home located in Tehama County with nearby schools including Jackson Heights Elementary School, Vista Preparatory Academy, and Red Bluff High School.
Ownership History
We collect this data history from publicly available records. To have your information removed, we recommend requesting removal directly through your county’s website.
Purchase Details
Home Financials for this Owner
Home Financials are based on the most recent Mortgage that was taken out on this home.Purchase History
We collect this data history from publicly available records. To have your information removed, we recommend requesting removal directly through your county’s website.
| Date | Buyer | Sale Price | Title Company |
|---|---|---|---|
| -- | First American Title Company |
Mortgage History
We collect this data history from publicly available records. To have your information removed, we recommend requesting removal directly through your county’s website.
| Date | Status | Borrower | Loan Amount |
|---|---|---|---|
| Closed | $150,000 |
Tax History
We collect this data history from publicly available records. To have your information removed, we recommend requesting removal directly through your county’s website.
| Year | Tax Paid | Tax Assessment Tax Assessment Total Assessment is a certain percentage of the fair market value that is determined by local assessors to be the total taxable value of land and additions on the property. | Land | Improvement |
|---|---|---|---|---|
| 2025 | $1,067 | $104,575 | $23,427 | $81,148 |
| 2023 | $1,049 | $100,516 | $22,518 | $77,998 |
| 2022 | $1,042 | $98,546 | $22,077 | $76,469 |
| 2021 | $1,000 | $96,615 | $21,645 | $74,970 |
| 2020 | $1,021 | $95,626 | $21,424 | $74,202 |
| 2019 | $1,028 | $93,752 | $21,004 | $72,748 |
| 2018 | $951 | $91,915 | $20,593 | $71,322 |
| 2017 | $959 | $90,114 | $20,190 | $69,924 |
| 2016 | $896 | $88,348 | $19,795 | $68,553 |
| 2015 | -- | $87,022 | $19,498 | $67,524 |
| 2014 | $869 | $85,319 | $19,117 | $66,202 |
Map
- 728 Lincoln St
- 421 Lincoln St
- 855 Jackson St
- 355 Jackson St
- 541 Jefferson St
- 855 Johnson St
- 0 Jefferson St Unit SN26036140
- 322 Jackson St
- 545 Cedar St
- 535 Cedar St
- 1036 Johnson St
- 226 Madison St
- 1153 Cedar St
- 701 Rio St
- 1124 Union St
- 1020 Washington St
- 1039 1st St
- 1405 Robinson Dr
- 1158 Madison St
- 1158 Madison St Unit 2
Ask me questions while you tour the home.