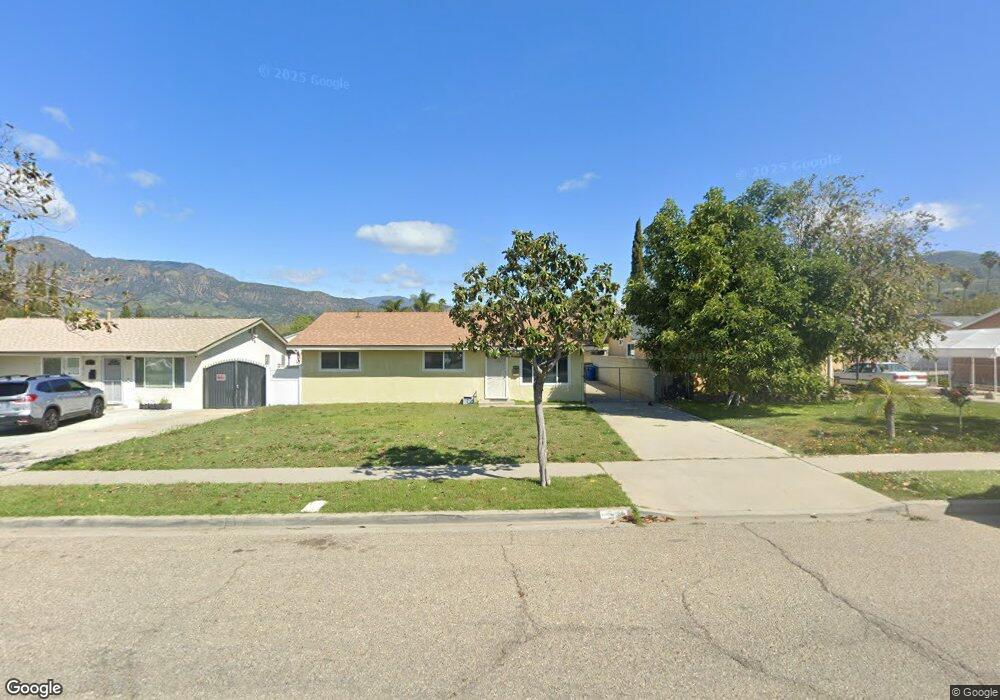
819 Sespe Ave Fillmore, CA 93015
Estimated Value: $594,777 - $728,000
3
Beds
2
Baths
1,120
Sq Ft
$593/Sq Ft
Est. Value
About This Home
This home is located at 819 Sespe Ave, Fillmore, CA 93015 and is currently estimated at $663,944, approximately $592 per square foot. 819 Sespe Ave is a home located in Ventura County with nearby schools including Rio Vista Elementary School and Fillmore Senior High.
Ownership History
Date
Name
Owned For
Owner Type
Purchase Details
Closed on
Sep 23, 2016
Sold by
Alvarez Jo Ann
Bought by
Alvarez Stephen and Alvarez Jo Ann
Current Estimated Value
Purchase Details
Closed on
Sep 30, 1995
Sold by
Arnold Vern and Clark Young W
Bought by
Warnock James Melvin and Warnock Jo Ann
Home Financials for this Owner
Home Financials are based on the most recent Mortgage that was taken out on this home.
Original Mortgage
$100,000
Interest Rate
7.04%
Create a Home Valuation Report for This Property
The Home Valuation Report is an in-depth analysis detailing your home's value as well as a comparison with similar homes in the area
Home Values in the Area
Average Home Value in this Area
Purchase History
We collect this data history from publicly available records. To have your information removed, we recommend requesting removal directly through your county’s website.
| Date | Buyer | Sale Price | Title Company |
|---|---|---|---|
| Alvarez Stephen | -- | None Available | |
| Alvarez Jo Ann | -- | None Available | |
| Warnock James Melvin | $125,000 | Old Republic Title Company |
Source: Public Records
Mortgage History
We collect this data history from publicly available records. To have your information removed, we recommend requesting removal directly through your county’s website.
| Date | Status | Borrower | Loan Amount |
|---|---|---|---|
| Previous Owner | Warnock James Melvin | $100,000 |
Source: Public Records
Tax History
| Year | Tax Paid | Tax Assessment Tax Assessment Total Assessment is a certain percentage of the fair market value that is determined by local assessors to be the total taxable value of land and additions on the property. | Land | Improvement |
|---|---|---|---|---|
| 2025 | $2,392 | $213,440 | $85,372 | $128,068 |
| 2024 | $2,392 | $209,255 | $83,698 | $125,557 |
| 2023 | $2,360 | $205,152 | $82,056 | $123,096 |
| 2022 | $2,184 | $201,130 | $80,447 | $120,683 |
| 2021 | $2,481 | $197,187 | $78,870 | $118,317 |
| 2020 | $2,303 | $195,166 | $78,062 | $117,104 |
| 2019 | $2,310 | $191,340 | $76,532 | $114,808 |
| 2018 | $2,264 | $187,589 | $75,032 | $112,557 |
| 2017 | $2,277 | $183,911 | $73,561 | $110,350 |
| 2016 | $2,031 | $180,306 | $72,119 | $108,187 |
| 2015 | $1,973 | $177,600 | $71,037 | $106,563 |
| 2014 | $1,971 | $174,124 | $69,647 | $104,477 |
Source: Public Records
Map
Nearby Homes
- 1012 Ortega St
- 553 Grapefruit Ln
- 553 Sespe Ave
- 1129 1st St
- 135 Surrey Way
- 202 Avon Ln
- 1143 Los Serenos Dr
- 340 Central Ave
- 989 Santa fe St
- 300 Fillmore St
- 809 Woodgrove Rd
- 320 D St
- 586 Apricot Ln
- 815 Woodgrove Rd
- 534 Mulberry Ln
- 922 Hinckley Ln
- 512 Mulberry Ln
- 444 Mountain View St
- 639 Mountain View St
- 1401 Waterford Ln
Your Personal Tour Guide
Ask me questions while you tour the home.