Estimated Value: $127,932 - $242,000
3
Beds
2
Baths
1,104
Sq Ft
$150/Sq Ft
Est. Value
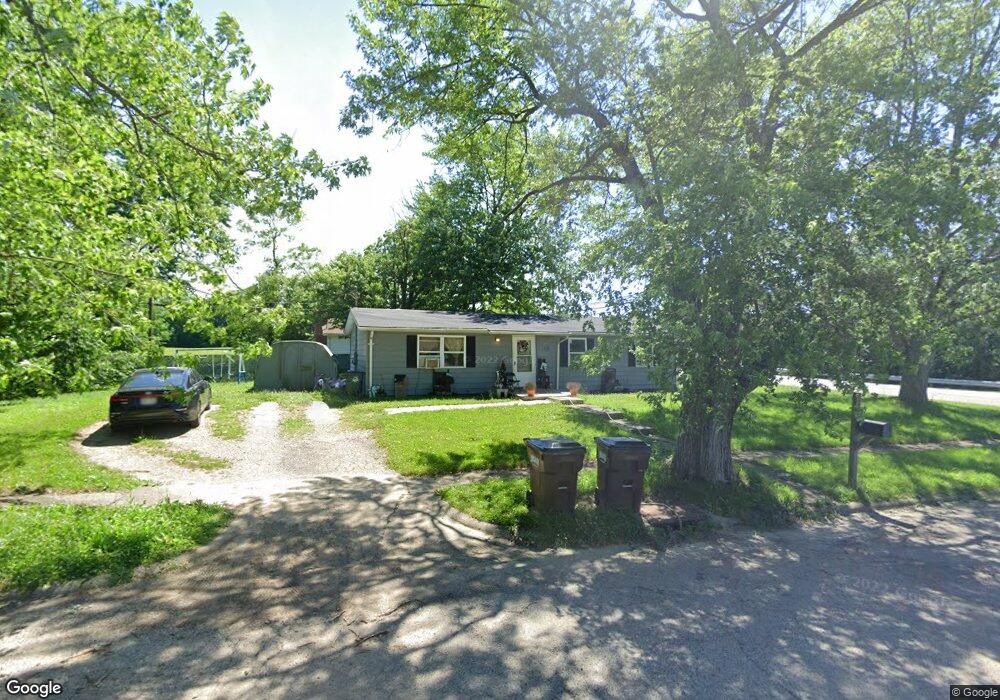
About This Home
This home is located at 819 Tremont Rd, Xenia, OH 45385 and is currently estimated at $165,733, approximately $150 per square foot. 819 Tremont Rd is a home located in Greene County with nearby schools including Xenia High School, Summit Academy Community School for Alternative Learners - Xenia, and Legacy Christian Academy.
Ownership History
Date
Name
Owned For
Owner Type
Purchase Details
Closed on
Jul 19, 2023
Sold by
Rivera Ciro G
Bought by
Rivera Ciro G and Rivera Teresa A
Current Estimated Value
Purchase Details
Closed on
Jul 24, 2003
Sold by
Hud
Bought by
Rivera Ciro
Home Financials for this Owner
Home Financials are based on the most recent Mortgage that was taken out on this home.
Original Mortgage
$33,000
Interest Rate
5.3%
Mortgage Type
Unknown
Purchase Details
Closed on
Jan 31, 2003
Sold by
South Lloyd E and South Mary A
Bought by
Hud
Purchase Details
Closed on
Feb 23, 1995
Sold by
Search Inc
Bought by
Lloyd E & Mary A South
Home Financials for this Owner
Home Financials are based on the most recent Mortgage that was taken out on this home.
Original Mortgage
$49,474
Interest Rate
9.21%
Mortgage Type
FHA
Create a Home Valuation Report for This Property
The Home Valuation Report is an in-depth analysis detailing your home's value as well as a comparison with similar homes in the area
Home Values in the Area
Average Home Value in this Area
Purchase History
| Date | Buyer | Sale Price | Title Company |
|---|---|---|---|
| Rivera Ciro G | -- | None Listed On Document | |
| Rivera Ciro | $25,000 | Lakeside Title & Escrow Agen | |
| Hud | $38,000 | -- | |
| Lloyd E & Mary A South | $49,000 | -- |
Source: Public Records
Mortgage History
| Date | Status | Borrower | Loan Amount |
|---|---|---|---|
| Previous Owner | Rivera Ciro | $33,000 | |
| Previous Owner | Lloyd E & Mary A South | $49,474 |
Source: Public Records
Tax History Compared to Growth
Tax History
| Year | Tax Paid | Tax Assessment Tax Assessment Total Assessment is a certain percentage of the fair market value that is determined by local assessors to be the total taxable value of land and additions on the property. | Land | Improvement |
|---|---|---|---|---|
| 2024 | $922 | $21,560 | $2,350 | $19,210 |
| 2023 | $922 | $21,560 | $2,350 | $19,210 |
| 2022 | $775 | $15,450 | $2,140 | $13,310 |
| 2021 | $786 | $15,450 | $2,140 | $13,310 |
| 2020 | $753 | $15,450 | $2,140 | $13,310 |
| 2019 | $775 | $15,000 | $2,320 | $12,680 |
| 2018 | $779 | $15,000 | $2,320 | $12,680 |
| 2017 | $832 | $15,000 | $2,320 | $12,680 |
| 2016 | $832 | $15,720 | $2,320 | $13,400 |
| 2015 | $835 | $15,720 | $2,320 | $13,400 |
| 2014 | $799 | $15,720 | $2,320 | $13,400 |
Source: Public Records
Map
Nearby Homes
- 715 N Columbus St
- 835 Tremont Rd
- 845 Tremont Rd
- 859 Tremont Rd
- 781 N Columbus St
- 868 Tremont Rd
- 871 Tremont Rd
- 793 N Columbus St
- 883 Tremont Rd
- 807 N Columbus St
- 853 N Columbus St
- 233 Mulberry St
- 599 N Columbus St
- 867 N Columbus St
- 768 Lexington Ave
- 760 Lexington Ave
- 784 Lexington Ave
- 744 Lexington Ave
- 571 N Columbus St
- 816 Lexington Ave