Estimated Value: $275,024 - $318,000
3
Beds
1
Bath
1,079
Sq Ft
$272/Sq Ft
Est. Value
About This Home
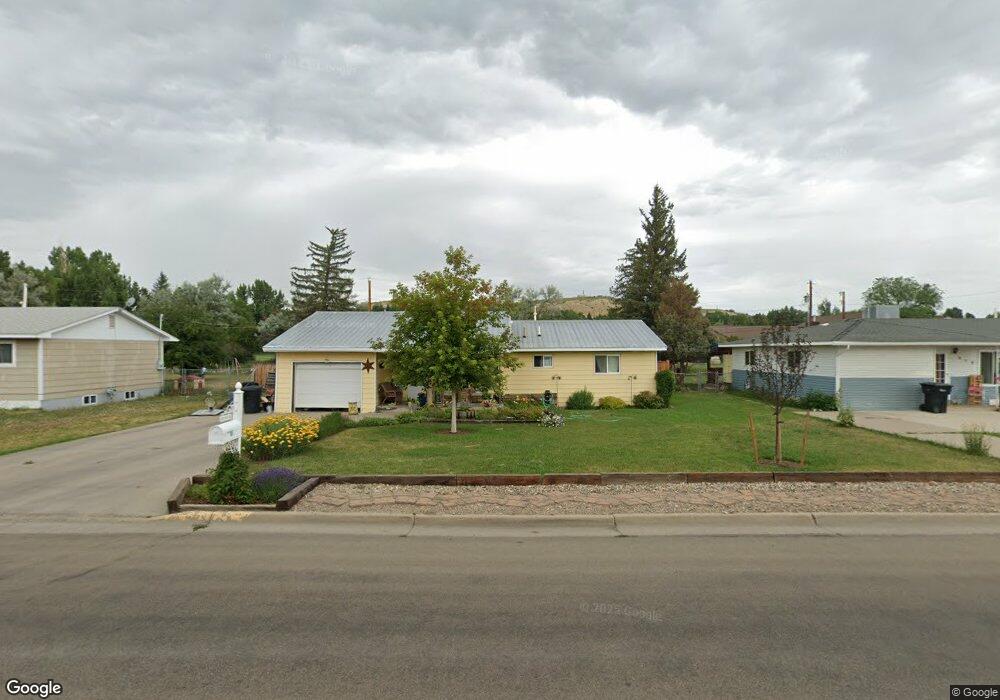
This home is located at 819 W 6th St, Craig, CO 81625 and is currently estimated at $294,006, approximately $272 per square foot. 819 W 6th St is a home located in Moffat County with nearby schools including Sunset Elementary School, Moffat County High School, and Calvary Baptist School.
Ownership History
Date
Name
Owned For
Owner Type
Purchase Details
Closed on
Jul 16, 2008
Sold by
Russo Donna L
Bought by
Lowrey Mark Allan and Lowrey Kathleen A
Current Estimated Value
Home Financials for this Owner
Home Financials are based on the most recent Mortgage that was taken out on this home.
Original Mortgage
$164,912
Outstanding Balance
$106,497
Interest Rate
6.09%
Mortgage Type
FHA
Estimated Equity
$187,509
Purchase Details
Closed on
Sep 19, 2006
Sold by
Lizardi Esthermac S
Bought by
Lizardi Esterhmac S
Create a Home Valuation Report for This Property
The Home Valuation Report is an in-depth analysis detailing your home's value as well as a comparison with similar homes in the area
Home Values in the Area
Average Home Value in this Area
Purchase History
| Date | Buyer | Sale Price | Title Company |
|---|---|---|---|
| Lowrey Mark Allan | $167,500 | None Available | |
| Lizardi Esterhmac S | -- | None Available |
Source: Public Records
Mortgage History
| Date | Status | Borrower | Loan Amount |
|---|---|---|---|
| Open | Lowrey Mark Allan | $164,912 |
Source: Public Records
Tax History Compared to Growth
Tax History
| Year | Tax Paid | Tax Assessment Tax Assessment Total Assessment is a certain percentage of the fair market value that is determined by local assessors to be the total taxable value of land and additions on the property. | Land | Improvement |
|---|---|---|---|---|
| 2024 | $750 | $8,650 | $0 | $0 |
| 2023 | $750 | $8,650 | $1,660 | $6,990 |
| 2022 | $873 | $10,360 | $2,450 | $7,910 |
| 2021 | $882 | $10,650 | $2,520 | $8,130 |
| 2020 | $827 | $10,120 | $2,520 | $7,600 |
| 2019 | $820 | $10,120 | $2,520 | $7,600 |
| 2018 | $786 | $9,660 | $2,540 | $7,120 |
| 2017 | $811 | $9,660 | $2,540 | $7,120 |
| 2016 | $850 | $10,470 | $2,810 | $7,660 |
| 2015 | $862 | $10,470 | $2,810 | $7,660 |
| 2013 | $862 | $10,470 | $2,810 | $7,660 |
Source: Public Records
Map
Nearby Homes