Estimated Value: $390,000 - $453,000
4
Beds
2
Baths
2,333
Sq Ft
$180/Sq Ft
Est. Value
About This Home
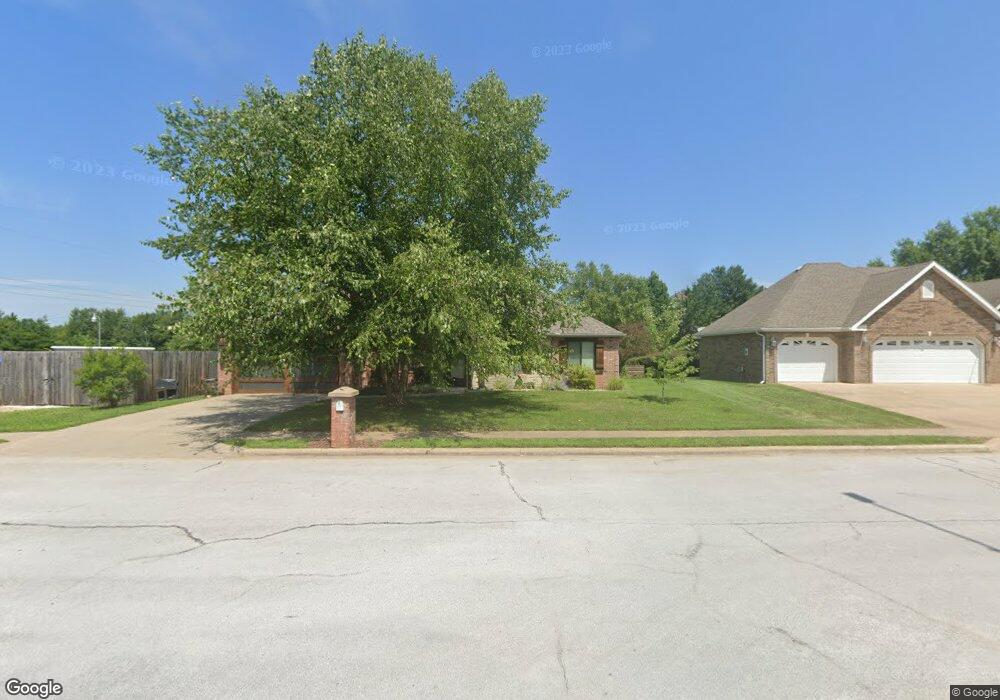
This home is located at 819 W Myra Dr, Nixa, MO 65714 and is currently estimated at $419,250, approximately $179 per square foot. 819 W Myra Dr is a home located in Christian County with nearby schools including Espy Elementary School, Queens Gateway to Health Sciences Secondary School, and Nicholas A. Inman Intermediate School.
Ownership History
Date
Name
Owned For
Owner Type
Purchase Details
Closed on
Apr 22, 2011
Sold by
Fent Randall and Fent Dianna
Bought by
Cosgrove Michael E and Cosgrove Jane E
Current Estimated Value
Home Financials for this Owner
Home Financials are based on the most recent Mortgage that was taken out on this home.
Original Mortgage
$155,897
Outstanding Balance
$107,856
Interest Rate
4.86%
Mortgage Type
New Conventional
Estimated Equity
$311,394
Purchase Details
Closed on
Aug 17, 2007
Sold by
Pratt Scott and Pratt Shawna
Bought by
Fent Randall and Fent Lianna
Home Financials for this Owner
Home Financials are based on the most recent Mortgage that was taken out on this home.
Original Mortgage
$64,000
Interest Rate
6.72%
Mortgage Type
New Conventional
Purchase Details
Closed on
Jul 15, 2005
Sold by
Bernard Construction Llc
Bought by
Pratt Scott and Pratt Shawna
Home Financials for this Owner
Home Financials are based on the most recent Mortgage that was taken out on this home.
Original Mortgage
$158,160
Interest Rate
5.61%
Mortgage Type
New Conventional
Create a Home Valuation Report for This Property
The Home Valuation Report is an in-depth analysis detailing your home's value as well as a comparison with similar homes in the area
Home Values in the Area
Average Home Value in this Area
Purchase History
| Date | Buyer | Sale Price | Title Company |
|---|---|---|---|
| Cosgrove Michael E | -- | None Available | |
| Fent Randall | -- | None Available | |
| Pratt Scott | -- | None Available |
Source: Public Records
Mortgage History
| Date | Status | Borrower | Loan Amount |
|---|---|---|---|
| Open | Cosgrove Michael E | $155,897 | |
| Previous Owner | Fent Randall | $64,000 | |
| Previous Owner | Pratt Scott | $158,160 |
Source: Public Records
Tax History Compared to Growth
Tax History
| Year | Tax Paid | Tax Assessment Tax Assessment Total Assessment is a certain percentage of the fair market value that is determined by local assessors to be the total taxable value of land and additions on the property. | Land | Improvement |
|---|---|---|---|---|
| 2024 | $2,534 | $40,660 | -- | -- |
| 2023 | $2,534 | $40,660 | $0 | $0 |
| 2022 | $2,478 | $39,710 | $0 | $0 |
| 2021 | $2,479 | $39,710 | $0 | $0 |
| 2020 | $2,390 | $36,540 | $0 | $0 |
| 2019 | $2,390 | $36,540 | $0 | $0 |
| 2018 | $2,125 | $35,260 | $0 | $0 |
| 2017 | $2,125 | $34,870 | $0 | $0 |
| 2016 | $2,092 | $34,870 | $0 | $0 |
| 2015 | $2,095 | $34,870 | $34,870 | $0 |
| 2014 | $2,030 | $34,640 | $0 | $0 |
| 2013 | $20 | $34,640 | $0 | $0 |
| 2011 | $20 | $69,280 | $0 | $0 |
Source: Public Records
Map
Nearby Homes
- 709 W Jackson Ave
- 703 W Laverne Dr
- Lot 24 Bentwater Phase 3
- 000 N Gregory Dr
- 000 W Bentwater Dr
- 000 N Massey Blvd
- 000 N Pine St
- 1719 N Pine St
- 851 Meadowview Dr
- 1826 Cody Ave
- 204 W Oak St
- 0 Missouri -- Unit 643 6915104
- 845 Lorenza Dr
- 1011 W Tracker Rd
- 110 W Maple St
- 1677 N State Highway Cc
- 1918 N Brookhollow Dr
- 610 N Cheyenne Valley Rd
- 1507 Granite Dr
- L 5 Ph 2 Tuscany Hills
- 817 W Myra Dr
- 816 Julie Ct
- 815 W Myra Dr
- 1701 N Julian St
- 814 Julie Ct
- 816 Myra Dr
- 1699 N Julian St
- 1698 N Julian St
- 818 Julie Ct
- 813 N Zachary Cir
- 812 W Jackson Ave
- 1697 N Julian St
- 817 Julie Ct
- 810 W Jackson Ave
- 1696 N Julian St
- 811 N Zachary Cir
- 1706 Zachary Ct
- 1701 Zachary Ct
- 1695 N Julian St
- 808 W Jackson Ave