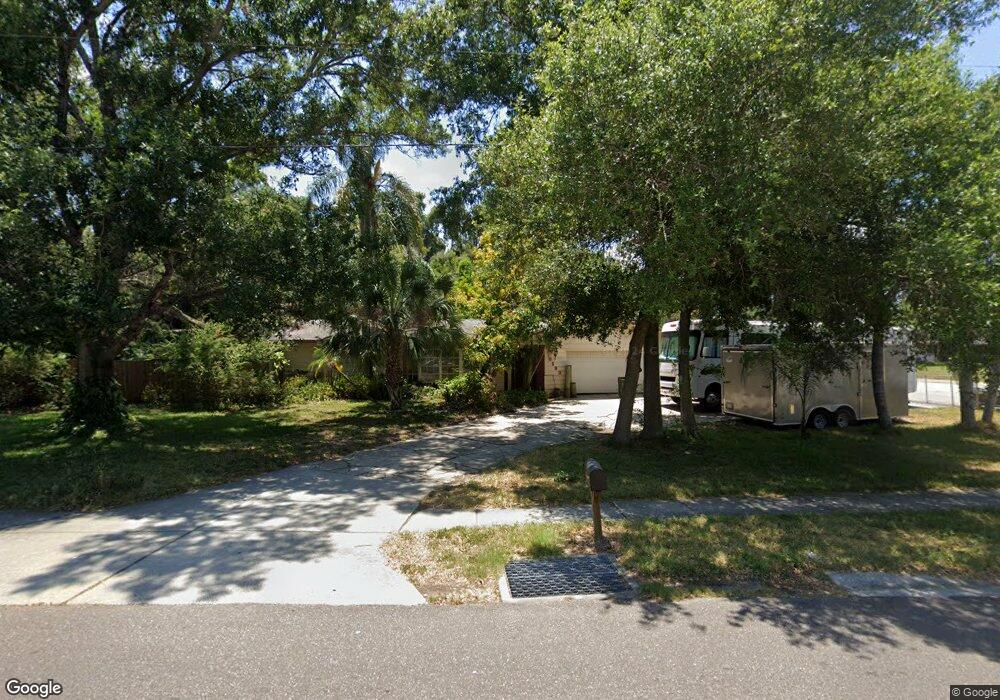
8190 57th St N Pinellas Park, FL 33781
Estimated Value: $439,000 - $468,000
--
Bed
2
Baths
1,661
Sq Ft
$271/Sq Ft
Est. Value
About This Home
This home is located at 8190 57th St N, Pinellas Park, FL 33781 and is currently estimated at $450,901, approximately $271 per square foot. 8190 57th St N is a home located in Pinellas County with nearby schools including Pinellas Park Elementary School, Pinellas Park Middle School, and Hollins High School.
Ownership History
Date
Name
Owned For
Owner Type
Purchase Details
Closed on
Mar 14, 2016
Sold by
Arruza Maria Teresa and Feinman Marc Andrew
Bought by
Arruza Maria Teresa
Current Estimated Value
Purchase Details
Closed on
Jan 2, 2013
Sold by
Vazquez Maria Del Carmen and Arruza Maria Teresa
Bought by
Arruza Maria Teresa
Purchase Details
Closed on
Dec 3, 1999
Sold by
Teetor Albert and Teetor Barbara
Bought by
Delcarmen Vazq Maria and Arruza Moll-Cu Maria T
Home Financials for this Owner
Home Financials are based on the most recent Mortgage that was taken out on this home.
Original Mortgage
$82,000
Outstanding Balance
$25,825
Interest Rate
7.94%
Mortgage Type
Credit Line Revolving
Estimated Equity
$425,076
Purchase Details
Closed on
Sep 24, 1993
Sold by
Hasemann Cynthia F and Meyers Elaine C
Bought by
Teetor Albert and Teetor Barbara
Home Financials for this Owner
Home Financials are based on the most recent Mortgage that was taken out on this home.
Original Mortgage
$105,900
Interest Rate
7.19%
Create a Home Valuation Report for This Property
The Home Valuation Report is an in-depth analysis detailing your home's value as well as a comparison with similar homes in the area
Home Values in the Area
Average Home Value in this Area
Purchase History
| Date | Buyer | Sale Price | Title Company |
|---|---|---|---|
| Arruza Maria Teresa | -- | Attorney | |
| Arruza Maria Teresa | $54,000 | Attorney | |
| Delcarmen Vazq Maria | $127,000 | -- | |
| Teetor Albert | $111,500 | -- |
Source: Public Records
Mortgage History
| Date | Status | Borrower | Loan Amount |
|---|---|---|---|
| Open | Delcarmen Vazq Maria | $82,000 | |
| Previous Owner | Teetor Albert | $105,900 |
Source: Public Records
Tax History Compared to Growth
Tax History
| Year | Tax Paid | Tax Assessment Tax Assessment Total Assessment is a certain percentage of the fair market value that is determined by local assessors to be the total taxable value of land and additions on the property. | Land | Improvement |
|---|---|---|---|---|
| 2024 | $2,048 | $133,083 | -- | -- |
| 2023 | $2,048 | $129,207 | $0 | $0 |
| 2022 | $1,979 | $125,444 | $0 | $0 |
| 2021 | $1,902 | $121,790 | $0 | $0 |
| 2020 | $1,702 | $120,108 | $0 | $0 |
| 2019 | $1,658 | $117,408 | $0 | $0 |
| 2018 | $1,624 | $115,219 | $0 | $0 |
| 2017 | $1,597 | $112,849 | $0 | $0 |
| 2016 | $1,570 | $110,528 | $0 | $0 |
| 2015 | $1,597 | $109,760 | $0 | $0 |
| 2014 | $1,583 | $108,889 | $0 | $0 |
Source: Public Records
Map
Nearby Homes
- 5825 81st Ave N
- 7954 59th St N
- 5946 81st Ave N
- 5712 78th Ave N
- 8330 59th Ln N
- 5431 82nd Ave N
- 8400 59th Ln N
- 8020 60th St N
- 6016 82nd Terrace N
- 5680 77th Ave N
- 5301 82nd Ave N
- 8701 56th St N
- 8436 60th St N Unit 304
- 8486 60th St N Unit 804
- 8795 56th St N
- 8472 60th St N Unit 702
- 8454 60th St N Unit 503
- 7645 55th St N
- 8848 56th Way N
- 5380 77th Ave N
- 8150 57th St N
- 8201 58th St N
- 5741 82nd Ave N
- 8161 58th Way N
- 8191 58th Way N
- 5721 82nd Ave N
- 8131 58th Way N
- 8155 57th St N
- 5680 81st Terrace N
- 8101 58th Way N
- 5801 82nd Ave N
- 5760 82nd Terrace N
- 5790 82nd Terrace N
- 5730 82nd Terrace N
- 5711 82nd Ave N
- 5700 82nd Terrace N
- 8081 58th Way N
- 5660 81st Terrace N
- 5681 81st Ave N
- 5811 82nd Ave N