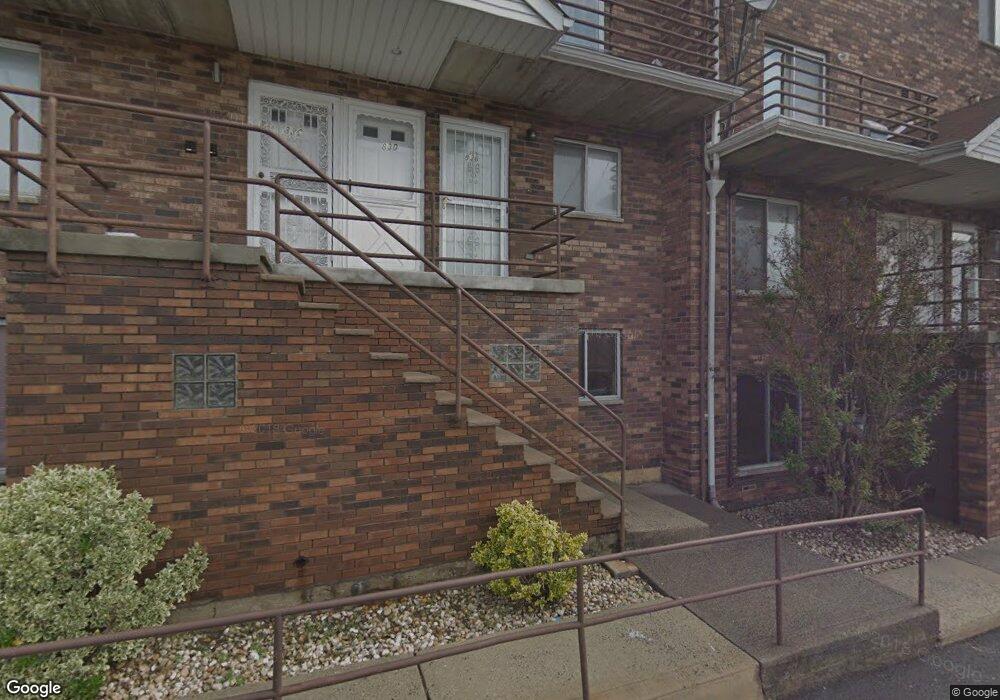
81C Narrows Rd N Unit 1C Staten Island, NY 10305
Rosebank NeighborhoodEstimated Value: $394,000 - $475,000
--
Bed
--
Bath
900
Sq Ft
$479/Sq Ft
Est. Value
About This Home
This home is located at 81C Narrows Rd N Unit 1C, Staten Island, NY 10305 and is currently estimated at $430,667, approximately $478 per square foot. 81C Narrows Rd N Unit 1C is a home located in Richmond County with nearby schools including P.S. 39 The Francis J. Murphy Jr. School, I.S. 49 Berta A Dreyfus, and Curtis High School.
Ownership History
Date
Name
Owned For
Owner Type
Purchase Details
Closed on
Mar 22, 2019
Sold by
Manzo Charles
Bought by
Us Bank Trust and Lsf9 Master Participation Trust
Current Estimated Value
Purchase Details
Closed on
Aug 14, 2007
Sold by
Manzo Donald and Manzo Charles
Bought by
Manzo Charles
Home Financials for this Owner
Home Financials are based on the most recent Mortgage that was taken out on this home.
Original Mortgage
$140,000
Interest Rate
6.87%
Mortgage Type
New Conventional
Purchase Details
Closed on
Feb 4, 2003
Sold by
260 Properties Corp
Bought by
Manzo Donald and Manzo Charles
Home Financials for this Owner
Home Financials are based on the most recent Mortgage that was taken out on this home.
Original Mortgage
$93,750
Interest Rate
5.83%
Mortgage Type
Unknown
Purchase Details
Closed on
Nov 7, 2002
Sold by
Costa Thomas and Mancuso Philip
Bought by
260 Properties Corp
Create a Home Valuation Report for This Property
The Home Valuation Report is an in-depth analysis detailing your home's value as well as a comparison with similar homes in the area
Home Values in the Area
Average Home Value in this Area
Purchase History
| Date | Buyer | Sale Price | Title Company |
|---|---|---|---|
| Us Bank Trust | $236,155 | Data Trace Title | |
| Manzo Charles | -- | The Judicial Title Insurance | |
| Manzo Donald | -- | Old Republic Natl Title Ins | |
| 260 Properties Corp | $125,000 | Old Republic Natl Title Ins |
Source: Public Records
Mortgage History
| Date | Status | Borrower | Loan Amount |
|---|---|---|---|
| Previous Owner | Manzo Charles | $140,000 | |
| Previous Owner | Manzo Donald | $93,750 |
Source: Public Records
Tax History Compared to Growth
Tax History
| Year | Tax Paid | Tax Assessment Tax Assessment Total Assessment is a certain percentage of the fair market value that is determined by local assessors to be the total taxable value of land and additions on the property. | Land | Improvement |
|---|---|---|---|---|
| 2025 | $3,251 | $33,058 | $6,473 | $26,585 |
| 2024 | $3,251 | $31,810 | $6,473 | $25,337 |
| 2023 | $3,039 | $24,772 | $6,473 | $18,299 |
| 2022 | $2,786 | $24,458 | $6,473 | $17,985 |
| 2021 | $2,587 | $21,488 | $6,473 | $15,015 |
| 2020 | $2,508 | $23,303 | $6,473 | $16,830 |
| 2019 | $2,327 | $25,660 | $6,473 | $19,187 |
| 2018 | $2,062 | $18,968 | $6,473 | $12,495 |
| 2017 | $2,038 | $16,020 | $6,472 | $9,548 |
| 2016 | $2,138 | $16,587 | $6,473 | $10,114 |
| 2015 | $1,896 | $15,061 | $6,473 | $8,588 |
| 2014 | $1,896 | $14,425 | $6,473 | $7,952 |
Source: Public Records
Map
Nearby Homes
- 91 Narrows Rd N Unit C
- 42 Narrows Rd S Unit 277
- 124 North Dr Unit 35
- 291 Hillbrook Dr
- 20 Brown Place
- 18 Brown Place
- 85 Dogwood Ln
- 8 Piedmont Ave
- 78 Claradon Ln Unit 170
- 282 Grasmere Dr Unit 131
- 756 Tompkins Ave
- 420 Maryland Ave Unit 3C
- 420 Maryland Ave Unit 3B
- 422 Maryland Ave Unit 1D
- 400 Maryland Ave Unit 1D
- 400 Maryland Ave Unit 3d
- 394 Maryland Ave Unit 2A
- 394 Maryland Ave Unit 3a
- 390 Maryland Ave Unit 2C
- 416 Maryland Ave Unit 2B
- 97D Narrows Rd N Unit 9D
- 93D Narrows Rd N Unit 7D
- 91D Narrows Rd N Unit 6D
- 91C Narrows Rd N Unit 6C
- 89D Narrows Rd N Unit 5D
- 85D Narrows Rd N Unit 3D
- 83C Narrows Rd N Unit 2C
- 91B Narrows Rd N Unit 6B
- 85B Narrows Rd N Unit 3B
- 81B Narrows Rd N Unit 1B
- 91A Narrows Rd N Unit 6A
- 85A Narrows Rd N Unit 3A
- 83A Narrows Rd N Unit 2A
- 81 Narrows Rd N Unit D
- 81 Narrows Rd N Unit C
- 81 Narrows Rd N
- 99 Narrows Rd N Unit D
- 99 Narrows Rd N Unit B
- 99 Narrows Rd N Unit C
- 91 Narrows Rd N Unit B