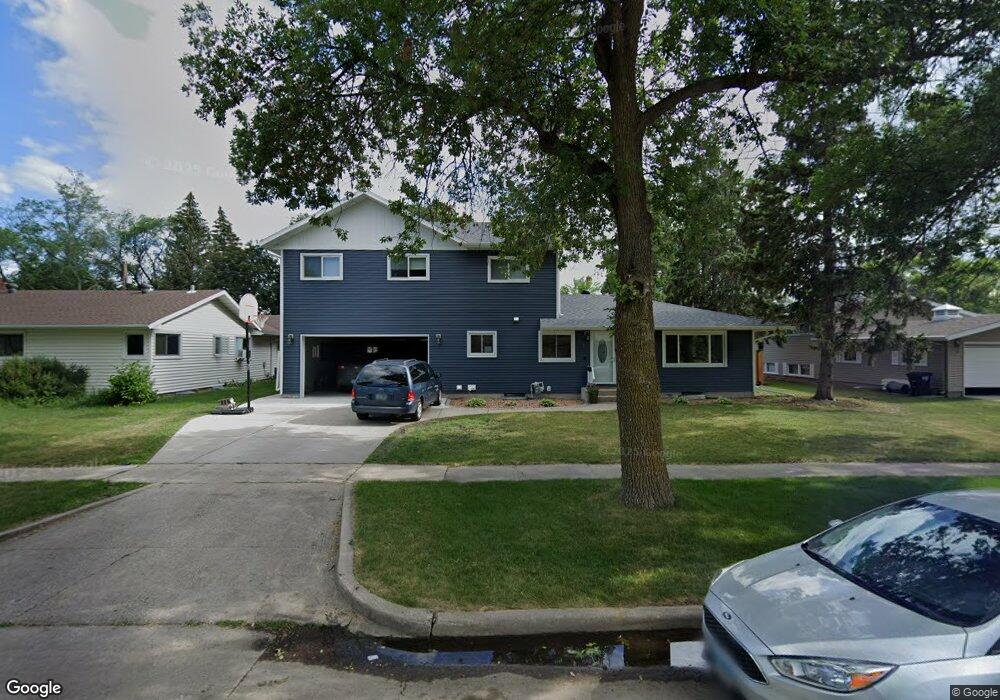
82 23rd Ave N Fargo, ND 58102
Northport NeighborhoodEstimated Value: $261,733 - $318,000
3
Beds
2
Baths
1,120
Sq Ft
$252/Sq Ft
Est. Value
About This Home
This home is located at 82 23rd Ave N, Fargo, ND 58102 and is currently estimated at $281,933, approximately $251 per square foot. 82 23rd Ave N is a home located in Cass County with nearby schools including Washington Elementary School, Ben Franklin Middle School, and North High School.
Ownership History
Date
Name
Owned For
Owner Type
Purchase Details
Closed on
Jul 27, 2011
Sold by
Swor Elaine C
Bought by
Reich Adam A and Reich Kristi L
Current Estimated Value
Home Financials for this Owner
Home Financials are based on the most recent Mortgage that was taken out on this home.
Original Mortgage
$107,200
Outstanding Balance
$74,051
Interest Rate
4.52%
Mortgage Type
New Conventional
Estimated Equity
$207,882
Create a Home Valuation Report for This Property
The Home Valuation Report is an in-depth analysis detailing your home's value as well as a comparison with similar homes in the area
Home Values in the Area
Average Home Value in this Area
Purchase History
| Date | Buyer | Sale Price | Title Company |
|---|---|---|---|
| Reich Adam A | $134,000 | None Available |
Source: Public Records
Mortgage History
| Date | Status | Borrower | Loan Amount |
|---|---|---|---|
| Open | Reich Adam A | $107,200 |
Source: Public Records
Tax History
| Year | Tax Paid | Tax Assessment Tax Assessment Total Assessment is a certain percentage of the fair market value that is determined by local assessors to be the total taxable value of land and additions on the property. | Land | Improvement |
|---|---|---|---|---|
| 2024 | $2,941 | $120,350 | $32,650 | $87,700 |
| 2023 | $3,254 | $114,000 | $32,650 | $81,350 |
| 2022 | $3,142 | $108,000 | $32,650 | $75,350 |
| 2021 | $3,083 | $108,000 | $32,650 | $75,350 |
| 2020 | $3,041 | $107,850 | $32,650 | $75,200 |
| 2019 | $2,636 | $100,150 | $18,150 | $82,000 |
| 2018 | $2,326 | $89,550 | $18,150 | $71,400 |
| 2017 | $2,234 | $86,950 | $18,150 | $68,800 |
| 2016 | $1,863 | $79,050 | $18,150 | $60,900 |
| 2015 | $1,987 | $79,050 | $13,600 | $65,450 |
| 2014 | $1,948 | $75,600 | $13,600 | $62,000 |
| 2013 | $1,857 | $72,000 | $13,600 | $58,400 |
Source: Public Records
Map
Nearby Homes
- 35 S Woodcrest Dr N
- 2510 Evergreen Rd N
- 301 21st Ave N
- 87 28th Ave N
- 305 19th Ave N
- 1830 4th St N
- 2925 Edgewood Dr N
- 3216 Broadway N
- 1905 9th St N
- 2937 Edgewood Dr N
- 1645 Broadway N
- 2939 Maple St N
- 1630 7th St N
- 108 32nd Ave N
- 206 32nd Ave N
- 1522 8th St N
- 1437 Broadway N Unit 101
- 1625 11th St N
- 21 35th Ave NE
- 1345 4th St N