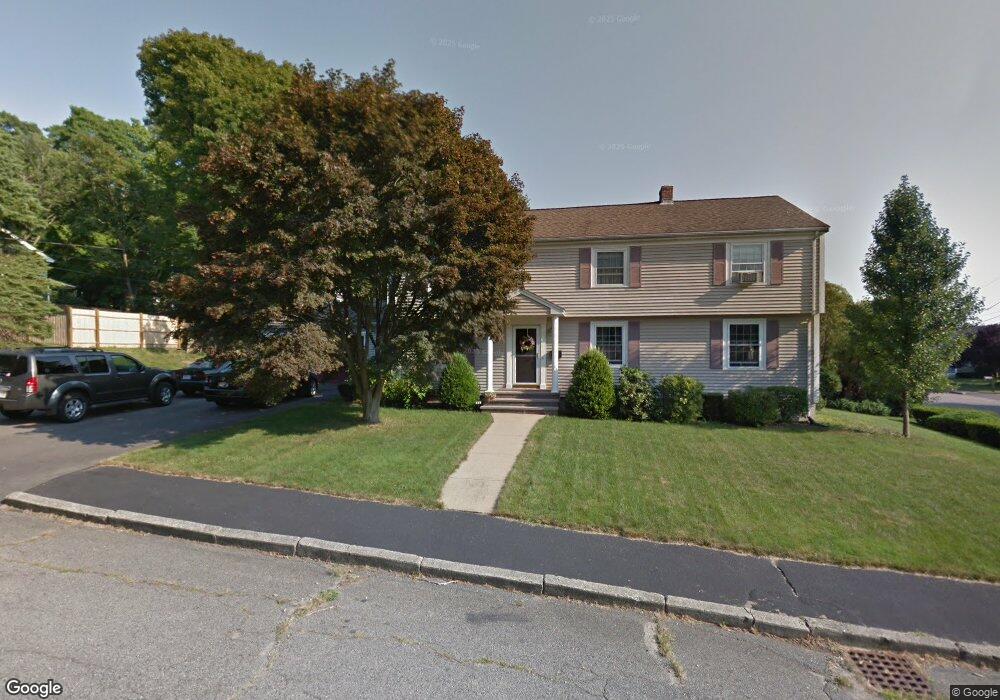
82 Alroy Rd South Weymouth, MA 02190
South Weymouth NeighborhoodEstimated Value: $757,662 - $851,000
4
Beds
3
Baths
1,960
Sq Ft
$411/Sq Ft
Est. Value
About This Home
This home is located at 82 Alroy Rd, South Weymouth, MA 02190 and is currently estimated at $804,916, approximately $410 per square foot. 82 Alroy Rd is a home located in Norfolk County with nearby schools including Thomas V Nash, Abigail Adams Middle School, and Weymouth Middle School Chapman.
Ownership History
Date
Name
Owned For
Owner Type
Purchase Details
Closed on
Jul 30, 1992
Sold by
Burke Stephen F and Burke Denise M
Bought by
Simonetti John A and Simonetti Linda F
Current Estimated Value
Home Financials for this Owner
Home Financials are based on the most recent Mortgage that was taken out on this home.
Original Mortgage
$125,000
Interest Rate
8.46%
Mortgage Type
Purchase Money Mortgage
Create a Home Valuation Report for This Property
The Home Valuation Report is an in-depth analysis detailing your home's value as well as a comparison with similar homes in the area
Home Values in the Area
Average Home Value in this Area
Purchase History
| Date | Buyer | Sale Price | Title Company |
|---|---|---|---|
| Simonetti John A | $184,000 | -- |
Source: Public Records
Mortgage History
| Date | Status | Borrower | Loan Amount |
|---|---|---|---|
| Open | Simonetti John A | $130,000 | |
| Closed | Simonetti John A | $125,000 |
Source: Public Records
Tax History Compared to Growth
Tax History
| Year | Tax Paid | Tax Assessment Tax Assessment Total Assessment is a certain percentage of the fair market value that is determined by local assessors to be the total taxable value of land and additions on the property. | Land | Improvement |
|---|---|---|---|---|
| 2025 | $6,387 | $632,400 | $225,800 | $406,600 |
| 2024 | $6,187 | $602,400 | $215,000 | $387,400 |
| 2023 | $6,178 | $591,200 | $217,200 | $374,000 |
| 2022 | $6,004 | $523,900 | $201,100 | $322,800 |
| 2021 | $5,830 | $496,600 | $201,100 | $295,500 |
| 2020 | $5,567 | $467,000 | $201,100 | $265,900 |
| 2019 | $5,477 | $451,900 | $193,400 | $258,500 |
| 2018 | $5,299 | $423,900 | $184,200 | $239,700 |
| 2017 | $5,262 | $410,800 | $175,400 | $235,400 |
| 2016 | $5,057 | $395,100 | $168,700 | $226,400 |
| 2015 | $4,836 | $374,900 | $168,700 | $206,200 |
| 2014 | $4,631 | $348,200 | $157,000 | $191,200 |
Source: Public Records
Map
Nearby Homes
- 16 Millstone Ln
- 120 Randolph St
- 1050 Main St Unit 1
- 27 Park Ave
- 54 Fountain Ln Unit 9
- 45 Union St
- 193 Randolph St
- 24 Fisher Rd
- 55 Greentree Ln Unit 19
- 685 Main St Unit 3
- 2 Mitchell Ln Unit B
- 65 Webster St Unit 401
- 16 Jay Rd
- 261 Pleasant St Unit 5
- 308 Forest St
- 7 Woodcrest Ct Unit 4
- 10 Woodcrest Ct Unit 4
- 25 Wales Ave
- 68 Massapoag St Unit 7
- 197 White St