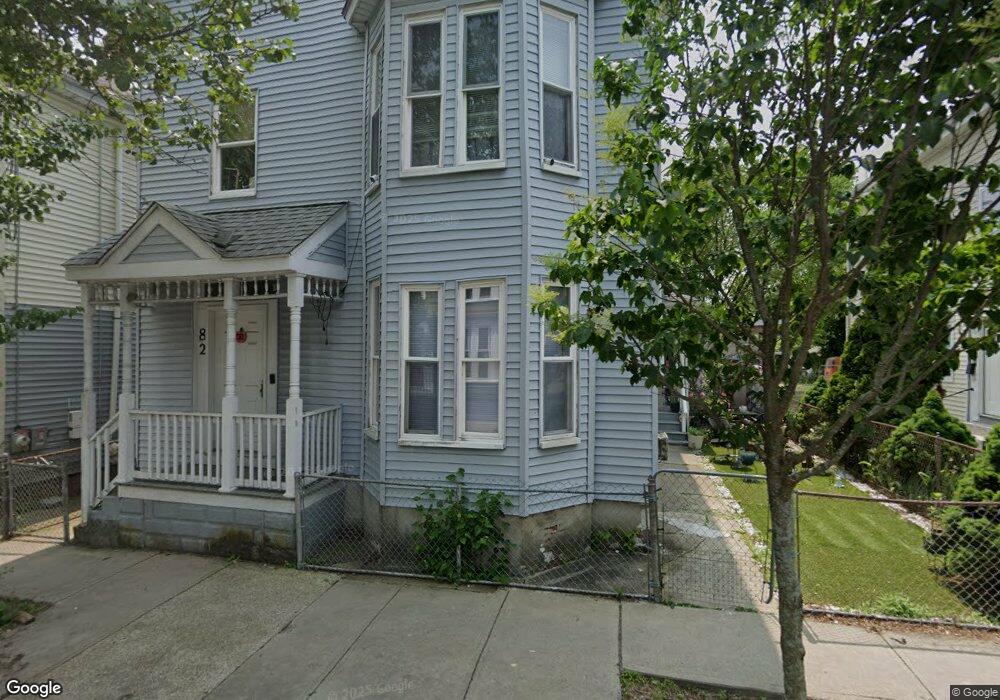
82 Appleton St Providence, RI 02909
Olneyville NeighborhoodEstimated Value: $541,000 - $619,000
6
Beds
3
Baths
2,292
Sq Ft
$254/Sq Ft
Est. Value
About This Home
This home is located at 82 Appleton St, Providence, RI 02909 and is currently estimated at $582,000, approximately $253 per square foot. 82 Appleton St is a home located in Providence County with nearby schools including Paul Cuffee Middle School and Blessed Sacrament School.
Ownership History
Date
Name
Owned For
Owner Type
Purchase Details
Closed on
Aug 13, 2013
Sold by
Jean Collas
Bought by
Reynosos Construction
Current Estimated Value
Home Financials for this Owner
Home Financials are based on the most recent Mortgage that was taken out on this home.
Original Mortgage
$52,000
Outstanding Balance
$38,645
Interest Rate
4.45%
Mortgage Type
New Conventional
Estimated Equity
$543,355
Purchase Details
Closed on
Oct 7, 1999
Sold by
Prov Neighborhood Corp
Bought by
Morales Alvaro and Morales Omayra
Home Financials for this Owner
Home Financials are based on the most recent Mortgage that was taken out on this home.
Original Mortgage
$35,650
Interest Rate
7.81%
Mortgage Type
Purchase Money Mortgage
Create a Home Valuation Report for This Property
The Home Valuation Report is an in-depth analysis detailing your home's value as well as a comparison with similar homes in the area
Home Values in the Area
Average Home Value in this Area
Purchase History
| Date | Buyer | Sale Price | Title Company |
|---|---|---|---|
| Reynosos Construction | $82,000 | -- | |
| Morales Alvaro | $63,500 | -- |
Source: Public Records
Mortgage History
| Date | Status | Borrower | Loan Amount |
|---|---|---|---|
| Open | Reynosos Construction | $52,000 | |
| Previous Owner | Morales Alvaro | $100,000 | |
| Previous Owner | Morales Alvaro | $35,650 | |
| Previous Owner | Morales Alvaro | $37,315 | |
| Closed | Morales Alvaro | $6,850 |
Source: Public Records
Tax History
| Year | Tax Paid | Tax Assessment Tax Assessment Total Assessment is a certain percentage of the fair market value that is determined by local assessors to be the total taxable value of land and additions on the property. | Land | Improvement |
|---|---|---|---|---|
| 2025 | $3,719 | $492,600 | $148,600 | $344,000 |
| 2024 | $5,918 | $322,500 | $72,300 | $250,200 |
| 2023 | $5,918 | $322,500 | $72,300 | $250,200 |
| 2022 | $5,741 | $322,500 | $72,300 | $250,200 |
| 2021 | $4,873 | $198,400 | $34,200 | $164,200 |
| 2020 | $4,873 | $198,400 | $34,200 | $164,200 |
| 2019 | $4,873 | $198,400 | $34,200 | $164,200 |
| 2018 | $3,758 | $117,600 | $28,200 | $89,400 |
| 2017 | $3,758 | $117,600 | $28,200 | $89,400 |
| 2016 | $3,758 | $117,600 | $28,200 | $89,400 |
| 2015 | $3,436 | $103,800 | $33,900 | $69,900 |
| 2014 | $3,503 | $103,800 | $33,900 | $69,900 |
| 2013 | $3,503 | $103,800 | $33,900 | $69,900 |
Source: Public Records
Map
Nearby Homes
Your Personal Tour Guide
Ask me questions while you tour the home.