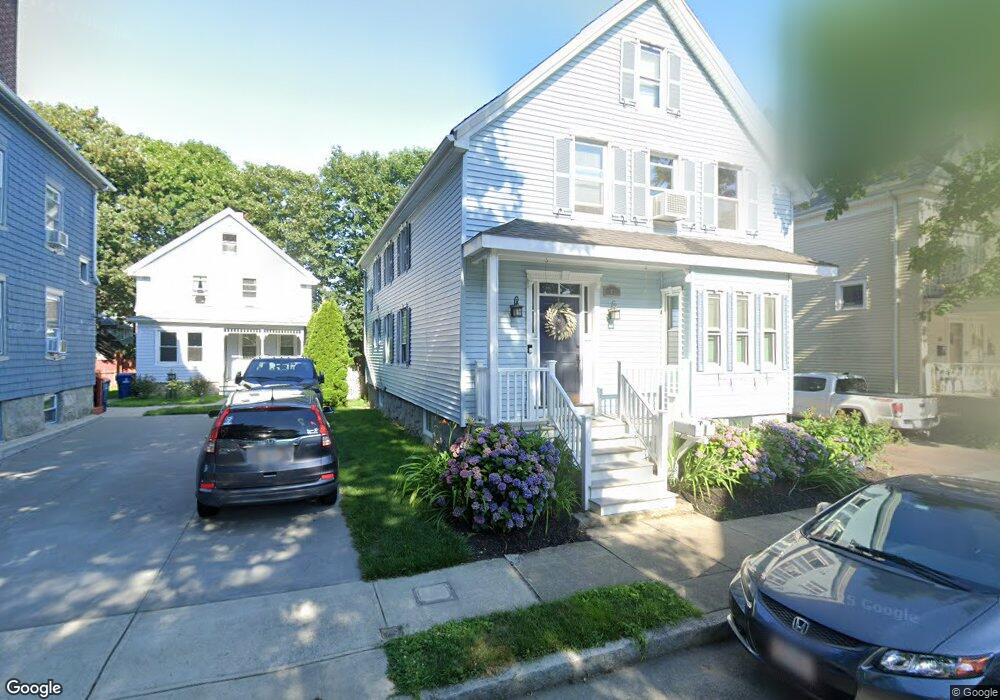
82 Atlantic St Unit 1 New Bedford, MA 02740
Downtown New Bedford NeighborhoodEstimated Value: $457,000 - $484,030
3
Beds
1
Bath
950
Sq Ft
$495/Sq Ft
Est. Value
About This Home
This home is located at 82 Atlantic St Unit 1, New Bedford, MA 02740 and is currently estimated at $470,508, approximately $495 per square foot. 82 Atlantic St Unit 1 is a home located in Bristol County with nearby schools including Ellen R. Hathaway Elementary School, Keith Middle School, and New Bedford High School.
Ownership History
Date
Name
Owned For
Owner Type
Purchase Details
Closed on
Oct 2, 2014
Sold by
Baganha Gilberto M and Baganha Emiliana
Bought by
Costa Chelcy L
Current Estimated Value
Home Financials for this Owner
Home Financials are based on the most recent Mortgage that was taken out on this home.
Original Mortgage
$209,632
Outstanding Balance
$156,865
Interest Rate
3.62%
Mortgage Type
FHA
Estimated Equity
$313,643
Purchase Details
Closed on
Feb 17, 2006
Sold by
Dias Michael S and Dias Raquel P
Bought by
Baganha Emiliana and Baganha Gilberto M
Create a Home Valuation Report for This Property
The Home Valuation Report is an in-depth analysis detailing your home's value as well as a comparison with similar homes in the area
Home Values in the Area
Average Home Value in this Area
Purchase History
| Date | Buyer | Sale Price | Title Company |
|---|---|---|---|
| Costa Chelcy L | $213,500 | -- | |
| Costa Chelcy L | $213,500 | -- | |
| Baganha Emiliana | $227,000 | -- | |
| Baganha Emiliana | $227,000 | -- |
Source: Public Records
Mortgage History
| Date | Status | Borrower | Loan Amount |
|---|---|---|---|
| Open | Costa Chelcy L | $209,632 | |
| Closed | Baganha Emiliana | $209,632 |
Source: Public Records
Tax History Compared to Growth
Tax History
| Year | Tax Paid | Tax Assessment Tax Assessment Total Assessment is a certain percentage of the fair market value that is determined by local assessors to be the total taxable value of land and additions on the property. | Land | Improvement |
|---|---|---|---|---|
| 2025 | $5,436 | $480,600 | $106,900 | $373,700 |
| 2024 | $4,438 | $369,800 | $108,600 | $261,200 |
| 2023 | $4,754 | $332,700 | $93,700 | $239,000 |
| 2022 | $4,281 | $274,600 | $89,000 | $185,600 |
| 2021 | $4,281 | $274,600 | $89,000 | $185,600 |
| 2020 | $4,182 | $258,800 | $89,000 | $169,800 |
| 2019 | $4,094 | $248,600 | $89,000 | $159,600 |
| 2018 | $3,818 | $229,600 | $89,000 | $140,600 |
| 2017 | $3,482 | $208,600 | $89,000 | $119,600 |
| 2016 | $3,105 | $188,300 | $89,000 | $99,300 |
| 2015 | $2,913 | $185,200 | $89,000 | $96,200 |
| 2014 | $2,700 | $178,100 | $83,700 | $94,400 |
Source: Public Records
Map
Nearby Homes