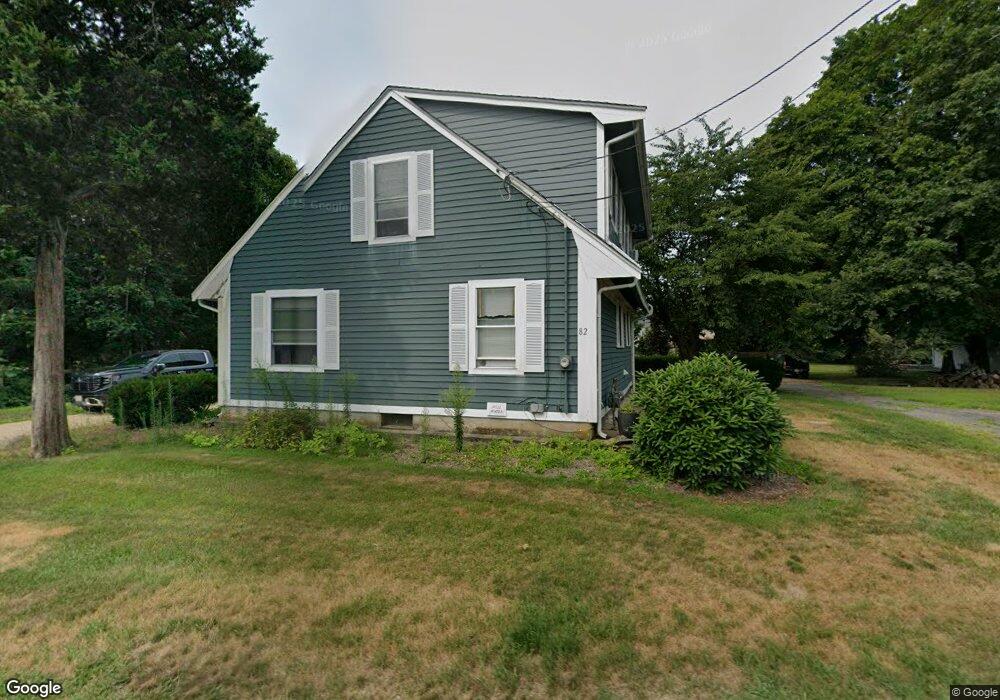
82 Bay Rd Norton, MA 02766
Estimated Value: $781,000 - $941,000
3
Beds
3
Baths
2,844
Sq Ft
$303/Sq Ft
Est. Value
About This Home
This home is located at 82 Bay Rd, Norton, MA 02766 and is currently estimated at $861,005, approximately $302 per square foot. 82 Bay Rd is a home located in Bristol County with nearby schools including L.G. Nourse Elementary School, Henri A. Yelle Elementary School, and Norton Middle School.
Ownership History
Date
Name
Owned For
Owner Type
Purchase Details
Closed on
Jan 22, 2025
Sold by
Day John W
Bought by
Jday Enterprises Ret and Day
Current Estimated Value
Purchase Details
Closed on
Apr 24, 2024
Sold by
Day John W and Day Loren
Bought by
Day John W
Purchase Details
Closed on
Feb 17, 2011
Sold by
Day John W
Bought by
Day John W and Day Loren
Purchase Details
Closed on
Feb 3, 2009
Sold by
Day John W and Day Lisa M
Bought by
Day John W
Home Financials for this Owner
Home Financials are based on the most recent Mortgage that was taken out on this home.
Original Mortgage
$260,000
Interest Rate
5.28%
Mortgage Type
Purchase Money Mortgage
Purchase Details
Closed on
Aug 16, 1996
Sold by
Defilippo Susan I and Defilippo Anthony P
Bought by
Day Lisa M and Day John W
Purchase Details
Closed on
Jun 7, 1996
Sold by
Defilippo Susan I and Defilippo Anthony P
Bought by
Day Lisa M and Day John W
Create a Home Valuation Report for This Property
The Home Valuation Report is an in-depth analysis detailing your home's value as well as a comparison with similar homes in the area
Home Values in the Area
Average Home Value in this Area
Purchase History
| Date | Buyer | Sale Price | Title Company |
|---|---|---|---|
| Jday Enterprises Ret | -- | -- | |
| Day John W | -- | None Available | |
| Day John W | -- | None Available | |
| Day John W | -- | -- | |
| Day John W | -- | -- | |
| Day John W | -- | -- | |
| Day John W | -- | -- | |
| Day John W | -- | -- | |
| Day John W | -- | -- | |
| Day Lisa M | $30,000 | -- | |
| Day Lisa M | $30,000 | -- | |
| Day Lisa M | $30,000 | -- | |
| Day Lisa M | $30,000 | -- |
Source: Public Records
Mortgage History
| Date | Status | Borrower | Loan Amount |
|---|---|---|---|
| Previous Owner | Day John W | $260,000 |
Source: Public Records
Tax History Compared to Growth
Tax History
| Year | Tax Paid | Tax Assessment Tax Assessment Total Assessment is a certain percentage of the fair market value that is determined by local assessors to be the total taxable value of land and additions on the property. | Land | Improvement |
|---|---|---|---|---|
| 2025 | $9,508 | $733,100 | $189,200 | $543,900 |
| 2024 | $8,609 | $664,800 | $180,200 | $484,600 |
| 2023 | $8,230 | $633,600 | $169,900 | $463,700 |
| 2022 | $7,900 | $554,000 | $154,500 | $399,500 |
| 2021 | $7,416 | $496,700 | $147,100 | $349,600 |
| 2020 | $2,376 | $486,900 | $142,800 | $344,100 |
| 2019 | $0 | $467,600 | $137,400 | $330,200 |
| 2018 | $6,602 | $435,500 | $137,400 | $298,100 |
| 2017 | $1,942 | $411,300 | $130,300 | $281,000 |
| 2016 | $5,866 | $375,800 | $116,000 | $259,800 |
| 2015 | $5,697 | $370,200 | $113,700 | $256,500 |
| 2014 | $5,475 | $356,200 | $108,300 | $247,900 |
Source: Public Records
Map
Nearby Homes
- 145 Burt St Unit 1
- 139 Burt St Unit 6
- 127 King Philip Rd
- 30 Samoset St
- O Leonard St
- 1 Carlton Dr
- 14 Downing Dr
- 4 Stanley Rd
- 132 S Washington St Unit 132
- 17 Lloyd Cir Unit 36
- 24 Lloyd Cir Unit 34
- 260 S Washington St
- 16 Lloyd Cir Unit 30
- 135 S Washington St
- Lot 3B Hill St
- 195 E Main St
- 38 S Washington St
- 31 Owen Rd
- 15 S Washington St
- 0 S Washington St Unit 73437419