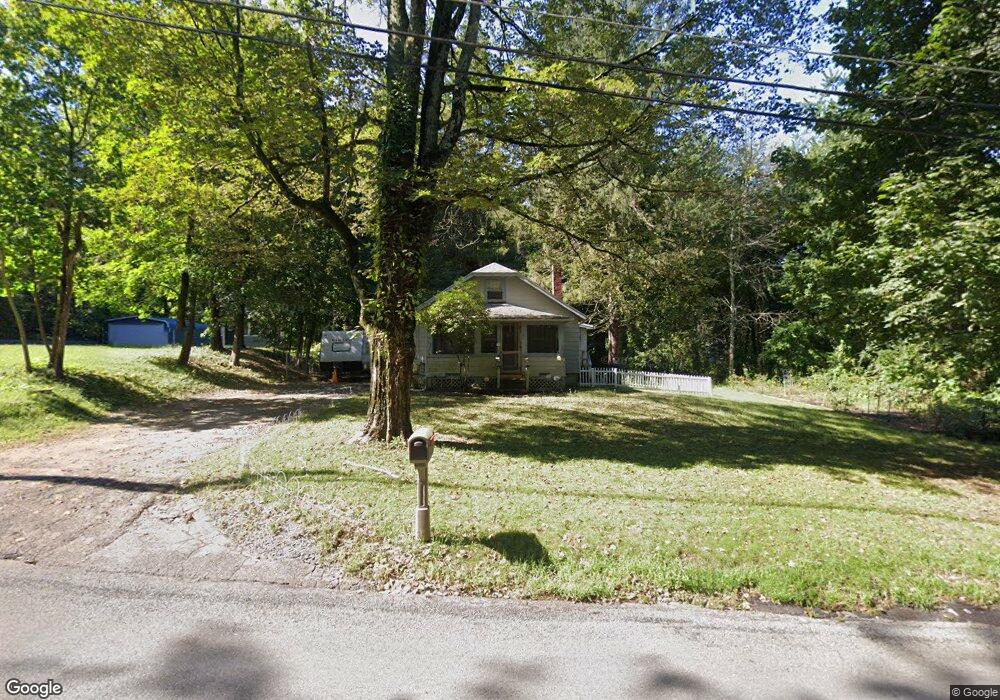
82 Beach St Wrentham, MA 02093
Estimated Value: $364,000 - $530,000
2
Beds
1
Bath
672
Sq Ft
$667/Sq Ft
Est. Value
About This Home
This home is located at 82 Beach St, Wrentham, MA 02093 and is currently estimated at $448,301, approximately $667 per square foot. 82 Beach St is a home located in Norfolk County with nearby schools including Delaney Elementary School and Charles E Roderick.
Ownership History
Date
Name
Owned For
Owner Type
Purchase Details
Closed on
Jun 18, 2024
Sold by
Robison Jane S and Robison Arthur J
Bought by
Robison Arthur J
Current Estimated Value
Purchase Details
Closed on
Apr 1, 1988
Sold by
Mcdonough Thomas
Bought by
Robison Arthur J
Home Financials for this Owner
Home Financials are based on the most recent Mortgage that was taken out on this home.
Original Mortgage
$98,000
Interest Rate
9.89%
Mortgage Type
Purchase Money Mortgage
Create a Home Valuation Report for This Property
The Home Valuation Report is an in-depth analysis detailing your home's value as well as a comparison with similar homes in the area
Home Values in the Area
Average Home Value in this Area
Purchase History
| Date | Buyer | Sale Price | Title Company |
|---|---|---|---|
| Robison Arthur J | -- | None Available | |
| Robison Arthur J | -- | None Available | |
| Robison Arthur J | $140,000 | -- |
Source: Public Records
Mortgage History
| Date | Status | Borrower | Loan Amount |
|---|---|---|---|
| Previous Owner | Robison Arthur J | $98,000 |
Source: Public Records
Tax History Compared to Growth
Tax History
| Year | Tax Paid | Tax Assessment Tax Assessment Total Assessment is a certain percentage of the fair market value that is determined by local assessors to be the total taxable value of land and additions on the property. | Land | Improvement |
|---|---|---|---|---|
| 2025 | $4,561 | $393,500 | $266,400 | $127,100 |
| 2024 | $3,828 | $319,000 | $266,400 | $52,600 |
| 2023 | $3,573 | $283,100 | $242,400 | $40,700 |
| 2022 | $3,664 | $268,000 | $235,800 | $32,200 |
| 2021 | $3,525 | $250,500 | $220,600 | $29,900 |
| 2020 | $3,052 | $214,200 | $169,200 | $45,000 |
| 2019 | $3,259 | $230,800 | $185,800 | $45,000 |
| 2018 | $3,539 | $248,500 | $185,900 | $62,600 |
| 2017 | $3,400 | $238,600 | $182,400 | $56,200 |
| 2016 | $3,316 | $232,200 | $177,100 | $55,100 |
| 2015 | $3,278 | $218,800 | $170,200 | $48,600 |
| 2014 | $3,342 | $218,300 | $163,700 | $54,600 |
Source: Public Records
Map
Nearby Homes
- Lot 1 - Blueberry 2 Car Plan at King Philip Estates
- Lot 8 - Blueberry 2 Car Plan at King Philip Estates
- Lot 5 - Hughes 2 car Plan at King Philip Estates
- Lot 6 - Blueberry 3 Car Plan at King Philip Estates
- Lot 2 - Camden 2 Car Plan at King Philip Estates
- Lot 7 - Cedar Plan at King Philip Estates
- Lot 4 - Hemingway 2 Car Plan at King Philip Estates
- Lot 3 - Blueberry 2 Car Plan at King Philip Estates
- Lot 3 - 14 Earle Stewart Ln
- 11 Earle Stewart Ln
- 791 South St Unit 5
- 319 Taunton St
- 131 Creek St Unit 7
- 10 Nature View Dr
- 15 Nature View Dr
- 155 Clark Rd Unit 155
- 570 Franklin St
- 1204 South St
- 1222 South St
- 362 East St