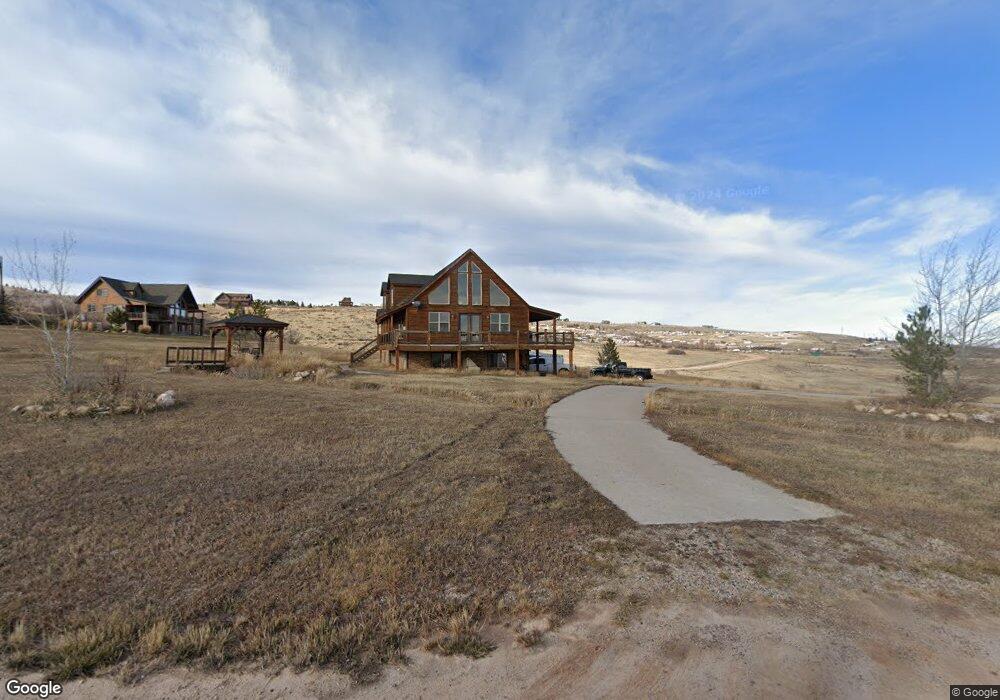
82 Canyon Point Way Fish Haven, ID 83287
Estimated Value: $1,259,000 - $1,618,000
5
Beds
4
Baths
4,896
Sq Ft
$297/Sq Ft
Est. Value
About This Home
This home is located at 82 Canyon Point Way, Fish Haven, ID 83287 and is currently estimated at $1,454,863, approximately $297 per square foot. 82 Canyon Point Way is a home located in Bear Lake County with nearby schools including Paris Elementary School and Bear Lake High School.
Ownership History
Date
Name
Owned For
Owner Type
Purchase Details
Closed on
Apr 29, 2021
Sold by
Barlow Wayne K
Bought by
Barlow Wayne K and Barlow Madeline Jones
Current Estimated Value
Home Financials for this Owner
Home Financials are based on the most recent Mortgage that was taken out on this home.
Original Mortgage
$525,000
Outstanding Balance
$475,037
Interest Rate
3%
Mortgage Type
New Conventional
Estimated Equity
$979,826
Purchase Details
Closed on
May 25, 2011
Sold by
Barlow Madeline J
Bought by
Barlow Wayne K
Home Financials for this Owner
Home Financials are based on the most recent Mortgage that was taken out on this home.
Original Mortgage
$417,000
Interest Rate
4.84%
Mortgage Type
New Conventional
Purchase Details
Closed on
May 24, 2011
Sold by
Townsley Jonathan C and Townsley Janet W
Bought by
Barlow Wayne K
Home Financials for this Owner
Home Financials are based on the most recent Mortgage that was taken out on this home.
Original Mortgage
$417,000
Interest Rate
4.84%
Mortgage Type
New Conventional
Purchase Details
Closed on
Apr 22, 2009
Sold by
Townsley Jonathan C and Townsley Janet
Bought by
Townsley Jonathan C and Townsley Janet W
Purchase Details
Closed on
Dec 29, 2005
Sold by
Bear Lake Group Llc
Bought by
Shaw Roger D and Shaw Sheila E
Create a Home Valuation Report for This Property
The Home Valuation Report is an in-depth analysis detailing your home's value as well as a comparison with similar homes in the area
Home Values in the Area
Average Home Value in this Area
Purchase History
| Date | Buyer | Sale Price | Title Company |
|---|---|---|---|
| Barlow Wayne K | -- | First Amer Ttl Montpelier | |
| Barlow Wayne K | -- | -- | |
| Barlow Wayne K | -- | -- | |
| Townsley Jonathan C | -- | -- | |
| Shaw Roger D | -- | -- |
Source: Public Records
Mortgage History
| Date | Status | Borrower | Loan Amount |
|---|---|---|---|
| Open | Barlow Wayne K | $525,000 | |
| Closed | Barlow Wayne K | $417,000 |
Source: Public Records
Tax History Compared to Growth
Tax History
| Year | Tax Paid | Tax Assessment Tax Assessment Total Assessment is a certain percentage of the fair market value that is determined by local assessors to be the total taxable value of land and additions on the property. | Land | Improvement |
|---|---|---|---|---|
| 2025 | $3,749 | $1,254,217 | $282,237 | $971,980 |
| 2024 | $3,749 | $1,265,227 | $282,237 | $982,990 |
| 2023 | $3,657 | $1,112,742 | $282,237 | $830,505 |
| 2022 | $3,887 | $1,018,883 | $179,198 | $839,685 |
| 2021 | $3,555 | $683,610 | $117,700 | $565,910 |
| 2020 | $3,813 | $591,250 | $110,000 | $481,250 |
| 2019 | $3,807 | $589,030 | $110,000 | $479,030 |
| 2018 | $3,678 | $579,040 | $110,000 | $469,040 |
| 2017 | $3,279 | $500,390 | $134,550 | $365,840 |
| 2016 | $3,401 | $496,770 | $134,550 | $362,220 |
| 2015 | $3,343 | $898,421 | $532,321 | $366,100 |
| 2014 | $3,655 | $518,230 | $144,540 | $373,690 |
| 2010 | -- | $532,470 | $160,600 | $371,870 |
Source: Public Records
Map
Nearby Homes
- 1060 Bear Lake Ln Unit 156
- 985 Bear Lake Ln Unit 321-
- 975 Bear Lake Ln Unit 320
- 68 Hawksbeard Cir
- 49 Primrose Cir Unit 200
- 748 Bear Lake Ln Unit 271
- 830 Bear Lake Ln Unit 290-92
- 804 Bear Lake Ln Unit 287-89
- 39 Primrose Cir Unit 199
- 31 Primrose Cir Unit 198
- 22 Yarrow Cir Unit 301
- 7 Primrose Cir Unit 196-97
- 4 Fireweed Cir Unit 74
- 12 Fireweed Cir Unit 73
- 20 Fireweed Cir Unit 72
- 28 Fireweed Cir Unit 71
- 36 Fireweed Cir Unit 70
- 75 Forest Cir Unit 4
- 63 Larkspur Cir Unit 223-27
- 728 Loveland Ln
- 1400 Canyon Estates Dr
- 139 Canyon Pointe Way
- 10 Canyon View Place
- 10 Canyon View Place Unit LOT2
- 110 Old Ephriam Rd Unit 68
- 206 Canyon View Place
- 1425 Canyon Estates Dr
- 83 Canyon View Place Unit 4
- 83 Canyon View Place Unit 4
- 1300 Canyon Estates Dr
- 135 Canyon View Place Unit 6
- 29 Canyon View Place Unit 3
- 29 Canyon View Place
- 1355 Canyon Estates Dr Unit 4
- 1355 Canyon Estates Dr
- 1455 Canyon Estates Dr
- 1200 Canyon Estates Dr Unit 2
- 325 Canyon Estates Dr
- 1297 Canyon Estates Dr
- 47 Camas Cir Unit 48