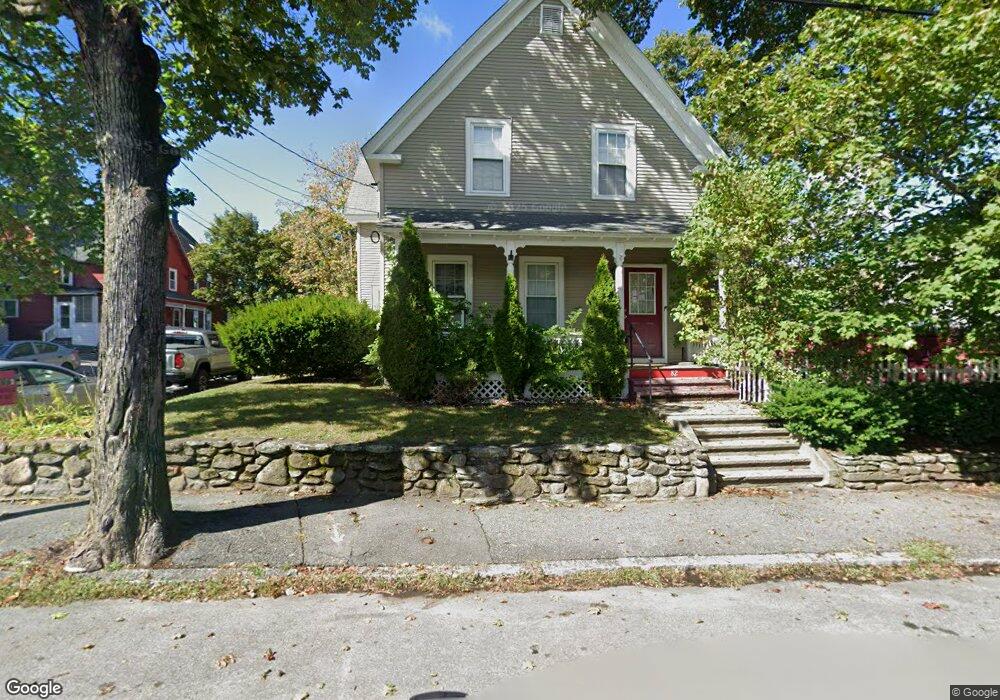
82 Cedar St Fitchburg, MA 01420
Estimated Value: $325,000 - $371,000
4
Beds
1
Bath
1,464
Sq Ft
$239/Sq Ft
Est. Value
About This Home
This home is located at 82 Cedar St, Fitchburg, MA 01420 and is currently estimated at $349,452, approximately $238 per square foot. 82 Cedar St is a home located in Worcester County with nearby schools including South Street Elementary School, Crocker Elementary School, and Fitchburg High School.
Ownership History
Date
Name
Owned For
Owner Type
Purchase Details
Closed on
Mar 31, 2020
Sold by
Baystate Investment Fund
Bought by
J & M Real Estate Holdings
Current Estimated Value
Purchase Details
Closed on
Jan 24, 2020
Sold by
Stage 1 Investors Llc
Bought by
Baystate Investment Fund
Purchase Details
Closed on
Jul 5, 1973
Bought by
Neforas Alice
Create a Home Valuation Report for This Property
The Home Valuation Report is an in-depth analysis detailing your home's value as well as a comparison with similar homes in the area
Home Values in the Area
Average Home Value in this Area
Purchase History
| Date | Buyer | Sale Price | Title Company |
|---|---|---|---|
| J & M Real Estate Holdings | $120,000 | None Available | |
| Baystate Investment Fund | $500,000 | None Available | |
| Neforas Alice | $19,900 | -- |
Source: Public Records
Mortgage History
| Date | Status | Borrower | Loan Amount |
|---|---|---|---|
| Previous Owner | Neforas Alice | $43,000 |
Source: Public Records
Tax History Compared to Growth
Tax History
| Year | Tax Paid | Tax Assessment Tax Assessment Total Assessment is a certain percentage of the fair market value that is determined by local assessors to be the total taxable value of land and additions on the property. | Land | Improvement |
|---|---|---|---|---|
| 2025 | $41 | $301,200 | $86,000 | $215,200 |
| 2024 | $3,861 | $260,700 | $51,000 | $209,700 |
| 2023 | $3,774 | $235,600 | $39,100 | $196,500 |
| 2022 | $4,223 | $239,800 | $34,400 | $205,400 |
| 2021 | $3,941 | $207,100 | $26,100 | $181,000 |
| 2020 | $3,747 | $190,100 | $21,300 | $168,800 |
| 2019 | $3,477 | $169,700 | $29,600 | $140,100 |
| 2018 | $3,130 | $149,000 | $27,300 | $121,700 |
| 2017 | $2,884 | $134,200 | $24,900 | $109,300 |
| 2016 | $2,754 | $129,700 | $24,900 | $104,800 |
| 2015 | $2,711 | $131,100 | $26,100 | $105,000 |
| 2014 | $2,600 | $131,100 | $26,100 | $105,000 |
Source: Public Records
Map
Nearby Homes
- 206 Highland Ave
- 56 Orange St
- 288-290 Pearl St
- 137 East St
- 1 Avon Place
- 825 John Fitch Hwy Unit 9
- 94 Fitch Hill Ave
- 855 John Fitch Hwy Unit 44
- 168 Lunenburg St
- 4 Brigham Park
- 29 Brigham Park
- 208 Blossom St
- 15-25 Lunenburg St
- 85 Boutelle St
- 62 Wendell Rd
- 36 Jackson Ave
- 112 Boutelle St
- 29 Mount Vernon St
- 46 Jackson Ave
- 34 Garnet St
- 90 Cedar St
- 6 Concord St
- 74 Cedar St
- 7 Concord St
- 96 Cedar St
- 181 Highland Ave
- 189 Highland Ave
- 70 Cedar St
- 91 Cedar St Unit 93
- 197 Highland Ave
- 67 Cedar St Unit 69
- 67 Cedar St
- 102 Cedar St
- 173-175 Highland Ave
- 173 Highland Ave Unit 175
- 173 Highland Ave
- 97 Cedar St
- 64 Cedar St
- 63-65 Cedar St Unit 2
- 201 Highland Ave