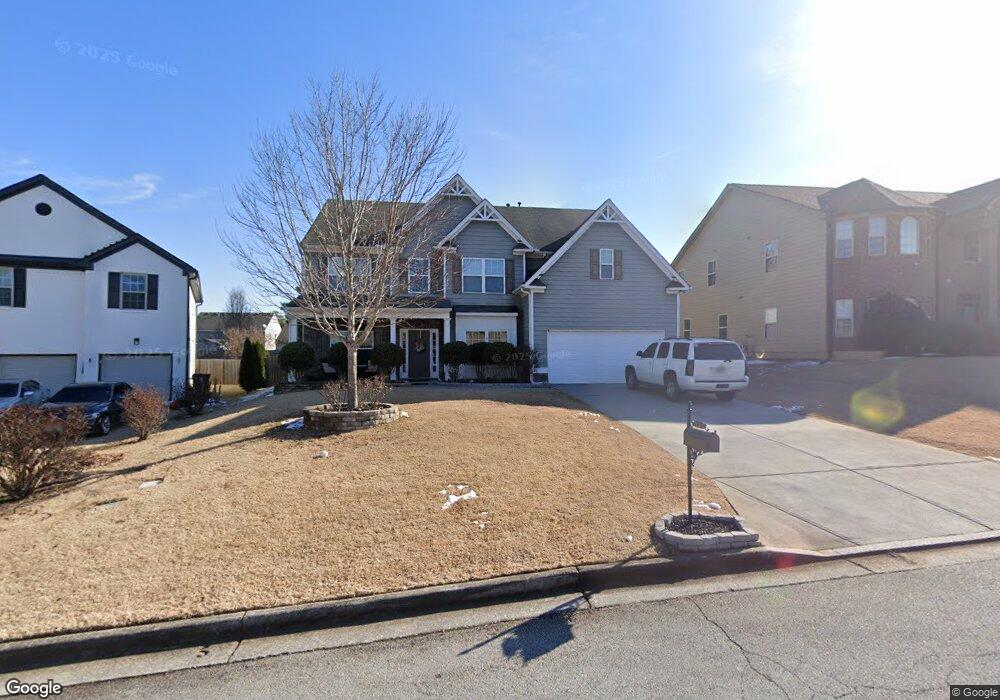
82 Cedarmont Way Dallas, GA 30132
Cedarcrest NeighborhoodEstimated Value: $439,000 - $496,000
5
Beds
3
Baths
3,217
Sq Ft
$146/Sq Ft
Est. Value
About This Home
This home is located at 82 Cedarmont Way, Dallas, GA 30132 and is currently estimated at $471,105, approximately $146 per square foot. 82 Cedarmont Way is a home with nearby schools including Floyd L. Shelton Elementary School at Crossroad, Sammy Mcclure Sr. Middle School, and North Paulding High School.
Ownership History
Date
Name
Owned For
Owner Type
Purchase Details
Closed on
Dec 6, 2016
Sold by
Piedmont Residential Llc
Bought by
Santana Omar F and Santana Valerie L
Current Estimated Value
Home Financials for this Owner
Home Financials are based on the most recent Mortgage that was taken out on this home.
Original Mortgage
$245,983
Interest Rate
3.87%
Mortgage Type
FHA
Purchase Details
Closed on
Feb 5, 2015
Sold by
Ms Land Llc
Bought by
Paran Homes Llc
Purchase Details
Closed on
Nov 26, 2013
Sold by
Mf Georgia Ii Llc
Bought by
Ms Land Llc
Purchase Details
Closed on
Nov 25, 2013
Sold by
Mf Georgia Ii Llc
Bought by
Ms Land Llc
Purchase Details
Closed on
Jun 25, 2010
Sold by
Synovus Bank
Purchase Details
Closed on
Sep 1, 2009
Sold by
Heritage Residential Of Pldg
Purchase Details
Closed on
Aug 12, 2008
Sold by
Tibbitts Wayne
Purchase Details
Closed on
Dec 12, 2006
Sold by
Palmer Development Co Inc
Purchase Details
Closed on
Dec 11, 2006
Sold by
Marathon Communities Llc
Create a Home Valuation Report for This Property
The Home Valuation Report is an in-depth analysis detailing your home's value as well as a comparison with similar homes in the area
Home Values in the Area
Average Home Value in this Area
Purchase History
| Date | Buyer | Sale Price | Title Company |
|---|---|---|---|
| Santana Omar F | $262,775 | -- | |
| Paran Homes Llc | -- | -- | |
| Ms Land Llc | $46,000 | -- |
Source: Public Records
Mortgage History
| Date | Status | Borrower | Loan Amount |
|---|---|---|---|
| Open | Santana Omar F | $245,983 |
Source: Public Records
Tax History Compared to Growth
Tax History
| Year | Tax Paid | Tax Assessment Tax Assessment Total Assessment is a certain percentage of the fair market value that is determined by local assessors to be the total taxable value of land and additions on the property. | Land | Improvement |
|---|---|---|---|---|
| 2024 | $4,715 | $192,792 | $16,000 | $176,792 |
| 2023 | $4,934 | $191,800 | $16,000 | $175,800 |
| 2022 | $4,230 | $164,120 | $16,000 | $148,120 |
| 2021 | $3,573 | $124,800 | $16,000 | $108,800 |
| 2020 | $3,334 | $114,120 | $16,000 | $98,120 |
| 2019 | $3,225 | $108,880 | $16,000 | $92,880 |
| 2018 | $3,150 | $106,400 | $16,000 | $90,400 |
| 2017 | $2,967 | $99,000 | $16,000 | $83,000 |
| 2016 | $296 | $9,800 | $9,800 | $0 |
| 2015 | $302 | $9,800 | $9,800 | $0 |
| 2014 | $61 | $1,920 | $1,920 | $0 |
| 2013 | -- | $1,280 | $1,280 | $0 |
Source: Public Records
Map
Nearby Homes
- 49 Boxwood Way
- 137 Boxwood Way
- 687 Belmont Ln
- 693 Belmont Ln
- 169 Elivia Way
- 214 Elivia Way
- 212 Elivia Way
- 645 Old Dallas Acworth Rd N
- 18 Crown Dr
- 64 Elivia Way
- 77 Rushing Creek Trail
- 332 Belmont Ln
- 299 Belmont Ln
- 62 Ridgewood Way
- 301 Parkmont Way
- 194 Branch Valley Way
- 1210 Cedarcrest Blvd
- 252 Stonewood Creek Dr
- 72 Cedarmont Way
- 94 Cedarmont Way
- 0 Cedarmont Way Unit 8571987
- 0 Cedarmont Way Unit 8261159
- 0 Cedarmont Way Unit 8497833
- 0 Cedarmont Way Unit 8914140
- 0 Cedarmont Way Unit 7325849
- 0 Cedarmont Way
- 104 Cedarmont Way
- 60 Cedarmont Way
- 85 Boxwood Way
- 95 Chicopee Way
- 95 Boxwood Way
- 67 Boxwood Way
- 105 Boxwood Way
- 105 Chicopee Way
- 105 Cedarmont Way
- 75 Boxwood Way
- 77 Cedarmont Way
- 57 Boxwood Way